Introduction
Tensiomyography (TMG) is a non-invasive method for measuring the contractile properties of skeletal muscles. It requires no effort on the part of the subject being assessed, and provides rapid, accurate information, without disrupting the daily working lives of sportsmen and women. It is used to assess muscle contraction characteristics and the contractile capacity of the superficial muscles1-7.
TMG measures geometrical changes (radial enlargement) taking place in the muscle belly during isometric contraction, in response to an electrical stimulus. The assessment is made using a pressure sensor connected to a high-precision digital displacement transducer placed perpendicular to the muscle belly. The muscle is stimulated with single twitch stimulus (pulse of 1 ms duration) using two self-adhesive electrodes (2-5 cm apart) placed symmetrically to the sensor, in such a way as not to affect the tendons.
As Valenčič8 reports, TMG assessment offers information, in the time domain, regarding the following parameters: maximal radial deformation or displacement of the muscle belly (Dm), contraction time (Tc), reaction time (Td), sustain time (Ts) and relaxation time (Tr). These parameters are used to assess the stiffness of the muscle and its balance vis-a-vis other muscle structures, muscle chains (flexion-extension) and extremities (right and left).
The value of Dm provides information on the radial deformation of the muscle belly caused by stimulation, expressed in millimetres. It indicates and assesses muscular stiffness, which differs from subject to subject and by muscle group as a function of morphofunctional characteristics and of the work that these structures have been required to perform. Low scores, compared to the average scores of a typical population, are indicative of a high degree of muscle tone and excessive stiffness in muscle structures. High scores, by contrast, indicate a lack of muscle tone3,5,9. The Td parameter indicates the time taken for the muscle to reach 10% of total observed displacement following stimulation. This will depend on the predominant fibre type, muscle fatigue status, and potentiation and activation levels10. Tc represents the time elapsing from the end of Td (10% of Dm) until 90% of maximum deformation is reached. The value of Ts represents the theoretical time over which the contraction is sustained; it is calculated by measuring the time elapsing between the moment when initial deformation reaches 50% of its maximum value, and the moment when deformation readings return, during relaxation, to 50% of maximum deformation. Tr provides information about fatigue levels: increased scores compared to normal scores for the subject, indicate potential fatigue status.
Although the reproducibility of the method has already been investigated by other researchers9,11,12, it is important to emphasise that methodological aspects are crucial for assuring precise and reliable measurements. This involves faithfully following a set protocol for each assessment.
Simunic11 suggests that is a variability of less than 5%, regardless of muscle tonus and sensor positioning. Krijaz et al9 reported a high level of reproducibility in the biceps brachii, with an error of 0.5- 2% and an intra-class correlation coefficient ranging between 0.86 and 0.98 for the five parameters they analysed. Earlier research by the present authors found that an error in sensor placement could affect the results in terms of muscle deformation measurement (Dm), although not influencing results for the other variables (Tc, Td, Ts and Tr)12.
In order to obtain robust and reliable data using pre-post measurements, it is necessary to minimise potential errors (differences detected between two measurements) that may derive from the measurement process (assessment protocol) due to an incorrect application of the measuring technique. Failure to adhere to a rigorous protocol may undermine the value of the method. One potential methodological issue could be the point at which the sensor is located. Simunic et al6 explored this possibility, although in their study the error caused by incorrect selection of the measurement point remained below 5%.
Starting from the assumption that no completely reliable assessment tool exists, the aim of the present study was to evaluate the reproducibility of the readings provided by TMG, analysing the consistency of measurements obtained from three assessments carried out on the same muscle group, in order to confirm the hypothesis that the result of an assessment does not vary significantly after repeated measurements of the same muscles in the same subjects, and thus that TMG is a potentially useful tool for studying muscles of sportsmen and women. The contractile properties of skeletal muscles were therefore analysed using TMG, placing the sensor in three different - albeit neighbouring - muscle locations.
Methods
Sample
Twenty five subjects (age: 25.7 ± 4.7; height: 179.75 ± 4.12 cm; body weight: 79.30 ± 2.35 kg); moderately active; all majoring in Sports Sciences. All participants were fully informed of the potential risks associated with the study, and signed written consent forms previously approved by the Research Ethics Committee of the Universidad de Las Palmas de Gran Canaria (ULPGC) (Canary Islands, Spain) in line with the criteria of the Helsinki Declaration for research involving human beings.
Procedure
Radial displacement was measured on the anterior rectus femoris in the dominant leg of each participant. The subjects lay on a stretcher, with elasticated strapping over their legs to hold their lower body in place. A tensiomyograph (digital displacement transducer TMG-BMC) was used, placing the sensor perpendicular to the tangential plane on the largest area above the muscle belly (fig. 1) in three distinct muscle positions. The first reading (O) was taken at the point recommended by the manufacturer (subjectively determined by the researcher, and identified both visually and by palpation), seeking out the area with the greatest amount of muscle belly, with the sensor at the midpoint in the line between the self-adhesive bipolar electrodes. Electrodes were symmetrically placed 5 cm distal and 5 cm proximal to the perpendicularly-positioned sensor tip. The measuring point was anatomically determined on the basis of the anatomical guide for electromyographers13. The other two measurement points, randomly assigned, were -2 and +2 cm away from the first measuring point.
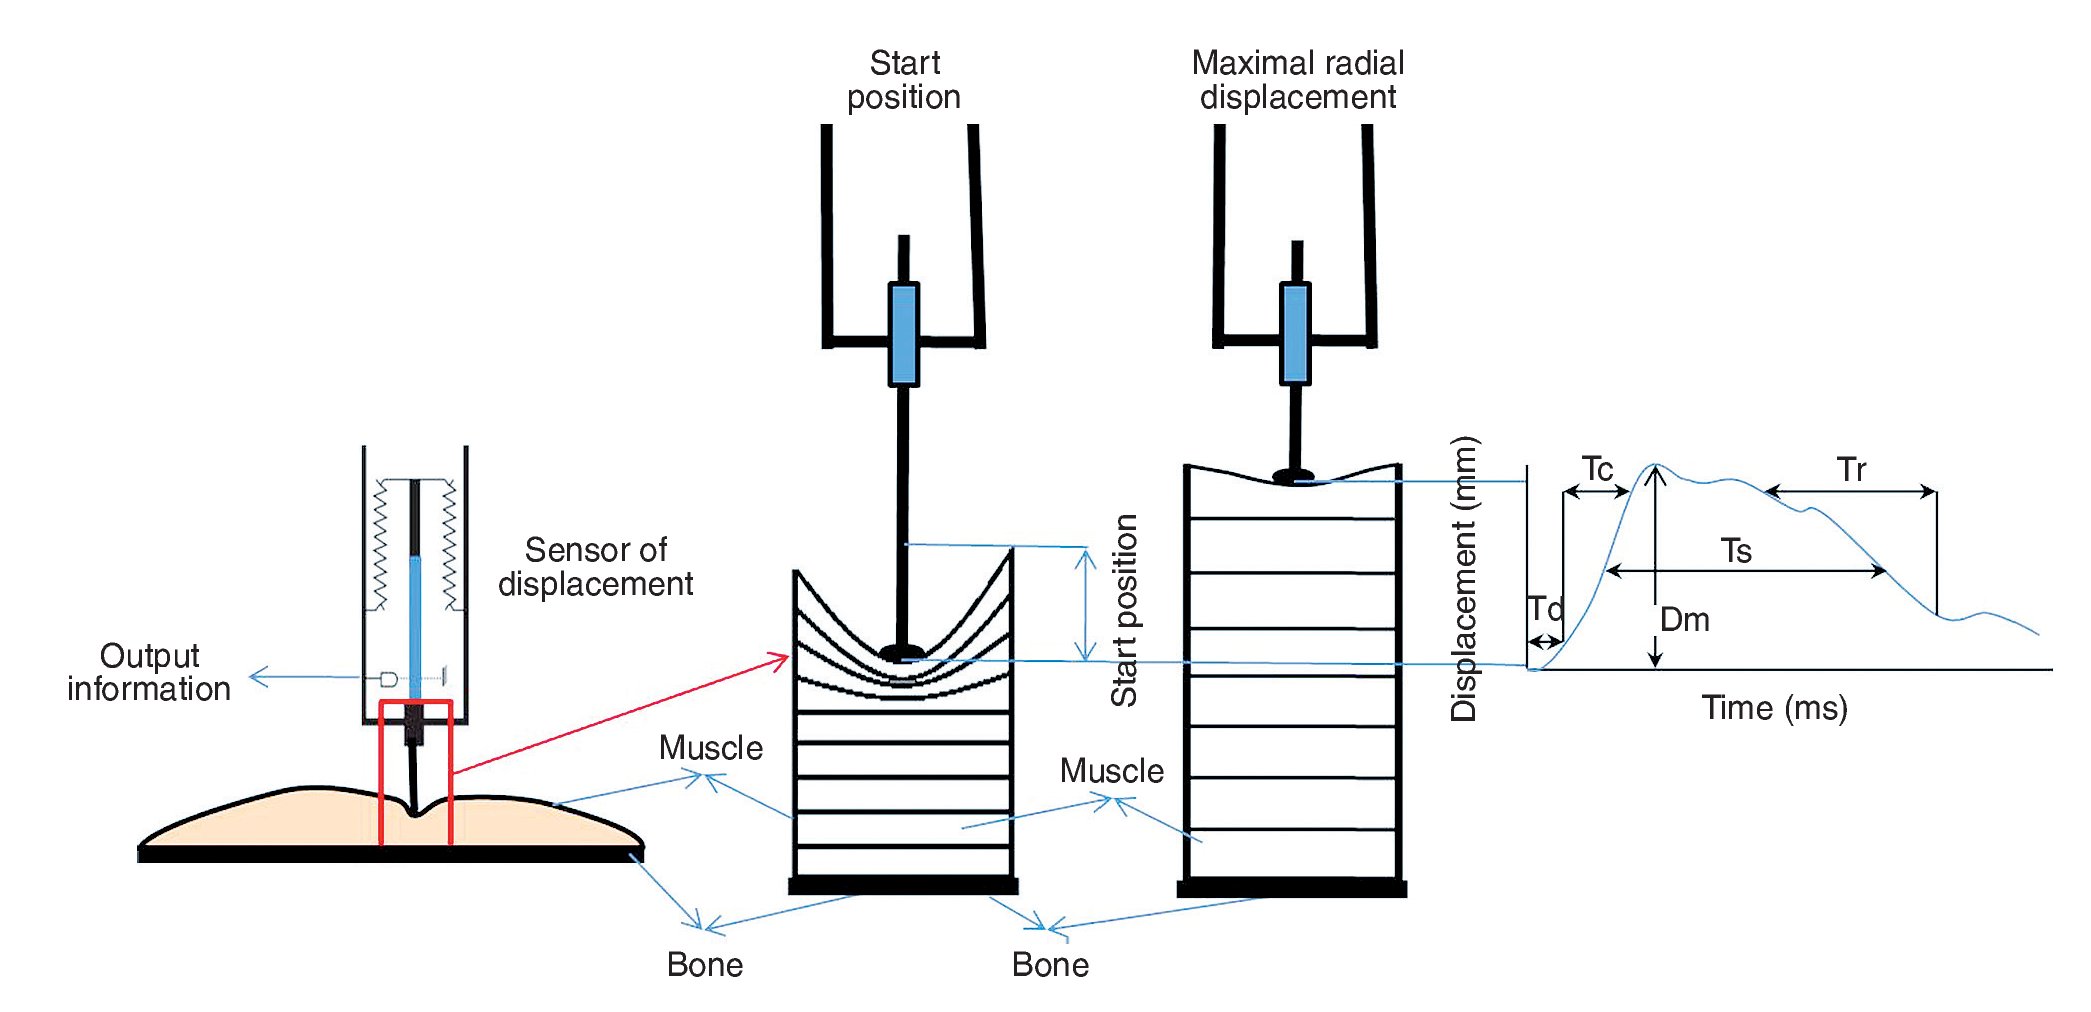
Fig. 1. Positioning of the displacement sensor on the muscle, and data collection process triggered by the electrical stimulus. Dm: maximum radial displacement of the muscle belly; Tc: contraction time; Td: reaction time; Ts:contraction sustain time; Tr: relaxation time.
The stimulation pulse was 1 ms, while amplitude was varied (50, 75 and 100 mAp) and selected so as to obtain a maximal response. The sensor was positioned in a way that applied an approximate pressure of 1.5 x 10⁻² N/mm2 over an area of 113 m2, as suggested by Dahmane et al3. In order to achieve this pressure, the sensor was calibrated beforehand by marking a pressure point on the sensor that had to be reached prior to each stimulus.
Statistical analysis
Data distribution was initially checked using the Kolmogorov-Smirnov test. Internal consistency was tested using Cronbach's alpha coefficient with values ranging between 0 (no internal consistency) and 1 (high internal consistency). The reproducibility of the test was determined by calculating the intra-class correlation (ANOVA for repeated measurements, with a Bonferroni multiple comparisons test with an alpha level significance value of 0.05) and the variation coefficient (individual and joint). The ANOVA for repeated measurements and Cronbach's alpha coefficient were determined on the basis of the subdivision of the total variation in three components (variation between subjects; variation between tests and variation arising from the relationships between subjects and tests). Individual and joint variation coefficients were determined on the basis of mean values and standard deviation for the three measurements undertaken. A coefficient of variation (CV) percentage below 5% was considered optimal, 5-10% acceptable and above 10% unacceptable. All statistics were calculated using the SPSS statistical package, version 17.0 (SPSS Inc., Chicago, IL, USA).
Results
Table 1 shows descriptive statistics (mean, standard deviation, maximum value and minimum value) for each of the variables analysed (Tc, Dm, Td, Ts and Tr) in the assessment of muscle performance in the anterior rectus.
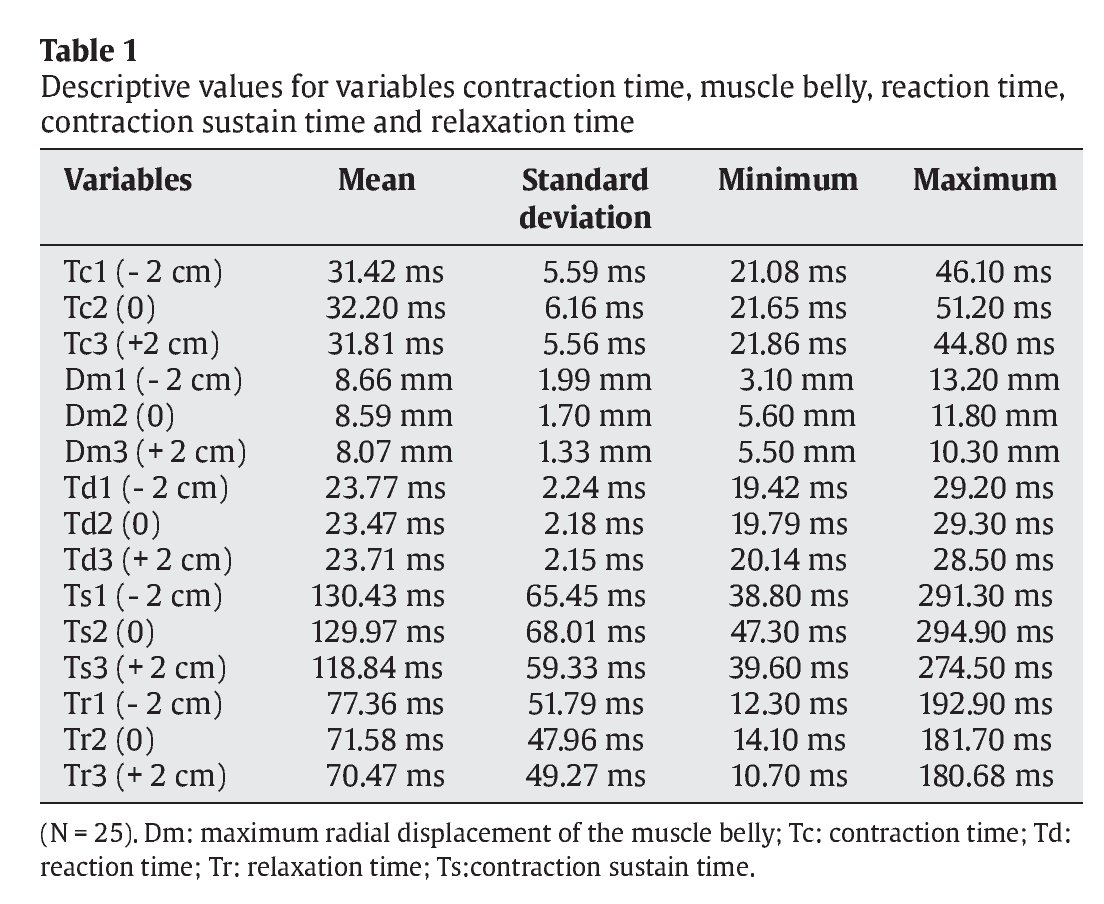
Table 2 shows internal consistency of the TMG using Cronbach's alpha coefficient for the five muscle parameters assessed (Tc, Dm, Td, Ts and Tr). It is noticeable that the index was greater than 0.95 for three of the variables analysed (Tc, Ts and Tr); for the other two (Dm and Td) it was greater than or close to 0.90, thus indicating a high degree of internal consistency.
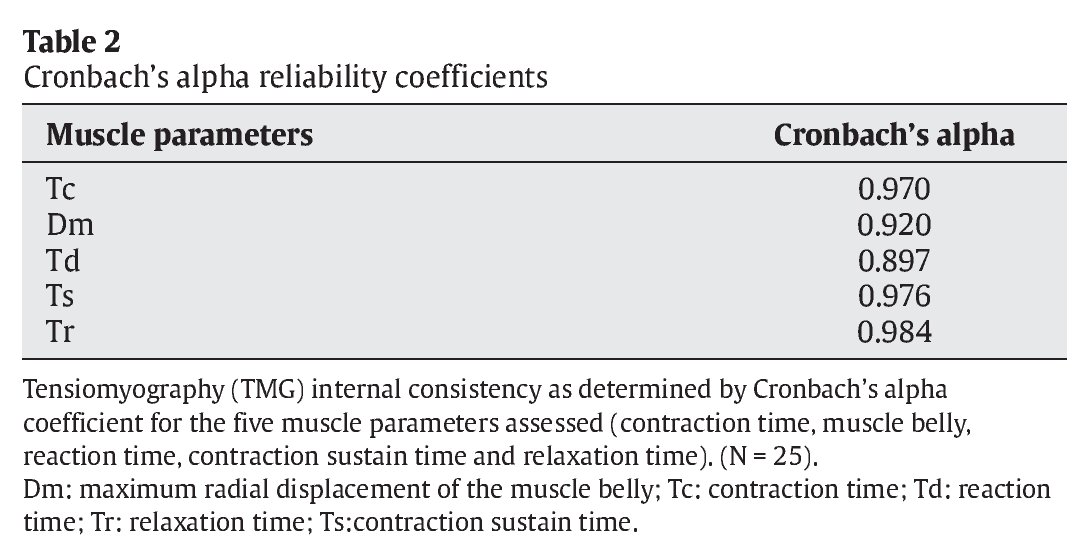
Table 3 shows reproducibility results obtained by repeated measurements (ANOVA), together with the results of the Bonferroni multiplemeans comparison test, based on assessment of the mechanical muscle characteristics using parameters provided by the TMG.

As table 3 shows, the mean values for Td, Tc, Ts and Tr in the three measurements displayed considerable uniformity; the mean value for Dm displayed minor differences between measurements as indicated by the comparison of means test (p = 1 for the comparison the T1 vs. T2; p = 0.839 for T2 vs. T3 series; and p = 0.671 for T1 vs. T3). The average value for Dm declined slightly as the number of stimuli increased and as the sensor moved away from the first measurement point.
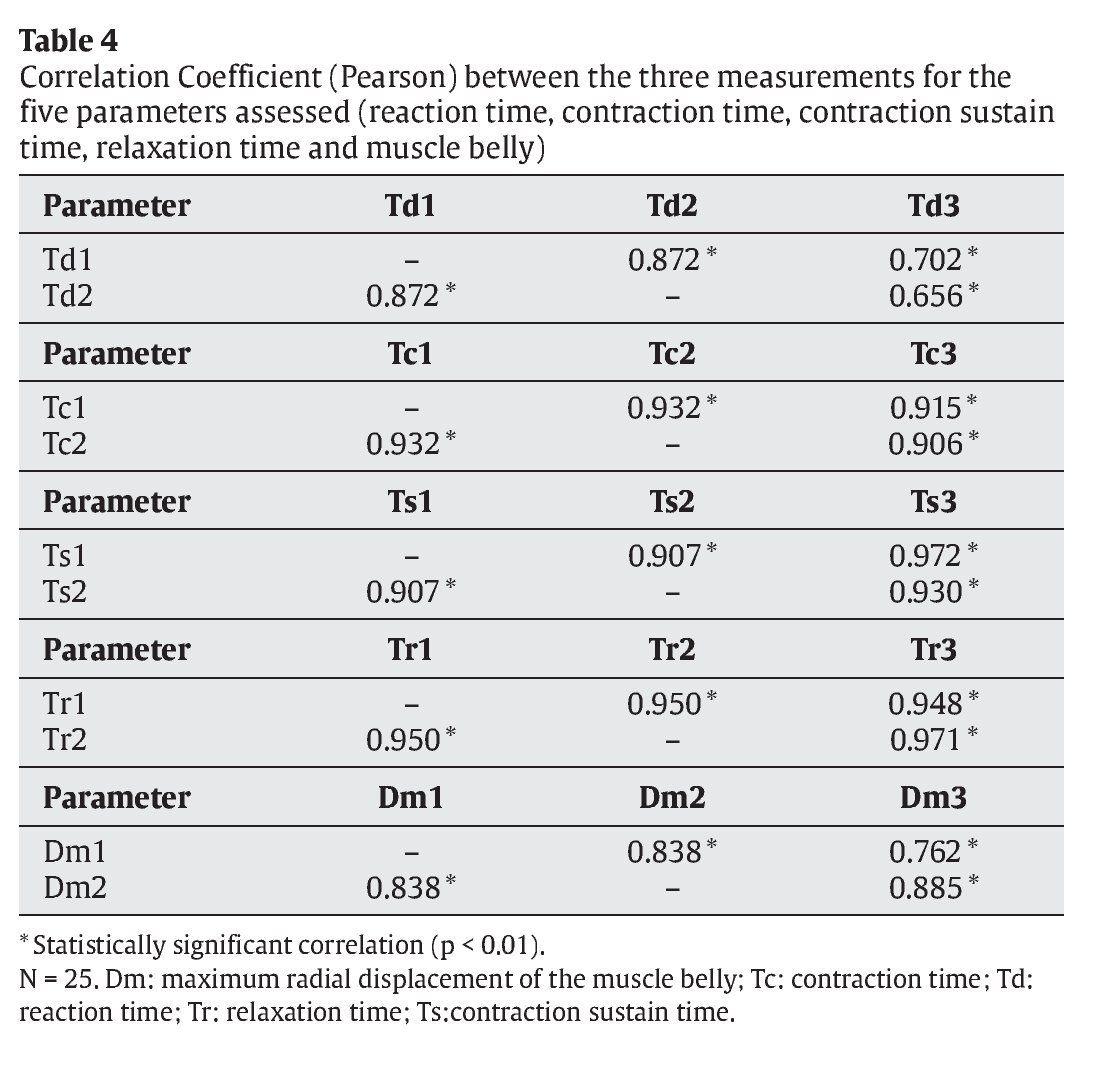
Strong correlations were noted in all three measurements (r > 0.9) for Tc, Tr and Ts (table 4). Correlations for Td and Dm were slightly lower (r > 0.9), especially with respect to the third measurement.
The box plot in figure 2 shows distribution of the data obtained from the three measurements (+2, 0, -2) for the five variables assessed by TMG (A: Td; B: Tc; C: Ts; D: Tr; E: Dm).

Fig. 2. Distribution of the data obtained from the three measurements (+2, 0, -2) for the five variables assessed by TMG (A: Td; B: Tc; C: Ts; D: Tr; E: Dm). (N = 25). Dm: maximum radial displacement of the muscle belly; Tc: contraction time; Td: reaction time; Tr: relaxation time; Ts: contraction sustain time.
Discussion
The findings show that, at least for measurements made on the rectus femoris, TMG offers a high degree of reproducibility; this makes it an excellent tool for assessing muscle structure status and the capacity of the muscle to respond to an external stimulus (single electrical stimulus).
However, the data shown confirm that failure to implement the methodological procedures scrupulously during measurement can cause minor changes to the final results. The most difficult factor to control in repeated measurements is the exact position of the sensor above the muscle. Modifying the position causes changes in muscle response, evident in the magnitude of the displacement recorded by the sensor. To the best of the authors' knowledge, this is the first study of reproducibility using three distinct positions for the five most common parameters and with a sample that provides the requisite statistical power.
The variable representing radial displacement of the muscle (Dm) displayed appreciable, although not statistically significant, differences between the three points under investigation, separated from the midpoint by 2 cm. The reading from the third measurement was slightly lower (8.07 ± 1.33 mm) than the other two; for example, muscle stiffness increased with the number of stimulations. To a certain extent, this finding runs counter to those of Valenčič et al5, who reported that the responses recorded by the displacement sensor were not affected by the complex biomechanical properties of joints or of the brace itself.
One possible explanation for this finding could be the time used in the present protocol to carry out each measurement (electrical stimulus). Since stimulation time was not controlled, the time elapsing between stimuli may have been insufficient to allow the muscle to return to a completely relaxed state. The authors believe that repeated electrical stimuli cause a neuromuscular potentiation (post-activation potentiation) that may increase the contractile capacity of skeletal muscle tissue14,15 and, as a result, affect the level of muscle deformation if they are repeated frequently without allowing sufficient recovery time. It should be stressed that the main muscle potentiation mechanism is the phosphorylation of regulatory myosin light chains (rMLC)16,17. The rate of the initial phosphorylation process (kinase proteins) and subsequent dephosphorylation (phosphatases) occuring at each muscle activation is relatively slow, which means that returning to rest levels may take several minutes after the end of the contraction17.
The likelihood of the muscle not being completely relaxed at the time of each stimulus was increased by the use of three stimuli for each measuring point (low intensity: 50 mAp; medium intensity: 75 mAp; high intensity: 100 mAp), meaning that the subject would have activated the same muscle structure nine times before reaching the maximum stimulus (100 mAp) in the third position (+2 cm). The increase in potentiation time rises when the muscle is stimulated repeatedly17.
It is also worth highlighting certain trends observed in the values of Ts and Tr when the sensor position was changed and the number of stimulations was increased. The box plot for these two parameters (fig. 2C and 2D), shows a slight tendency for this value to fall in some subjects.
Attention is also drawn to the possible morphological changes taking place in the analysed muscle when the sensor position was changed. Uniform shortening of muscle fibres does not exist in natural biological contexts. It has been suggested that the complexity of muscle architecture and the heterogeneous mechanical properties of muscle and tendon tissue may lead to non-uniform shortening18-24. Factors such as the non-uniform length of the sarcomere, myofibre or fascicle can alter the mechanical properties of the whole muscle25,26.
In conclusion, TMG has been shown to be a tool with a high degree of reproducibility for the assessment of muscle contractile properties in the anterior rectus. However, to ensure maximum reliability over repeated measurements it is necessary to adhere closely to a measurement protocol that does not alter muscle response. Sensor placement and complete muscle relaxation are two fundamental aspects of the measurement protocol and must be given due attention.
Correspondence:
J.M. García-Manso.
Campus Universitario de Tafira, s/n.
Edificio de Ciencias de la Actividad Física y el Deporte.
35017 Las Palmas de Gran Canaria. Gran Canaria. E-mail:
jgarcia@def.ulpgc.es
History of the article:
Received November 14, 2009
Accepted January 25, 2010