Introduction
Obesity may be defined as the build-up of body fat resulting from a long-term energy imbalance caused by excessive caloric intake and/or lack of physical activity. This imbalance may be prompted by environmental factors, but also by an impairment of the physiological mechanisms regulating the kinetics of energy and nutrient intake.
Research suggests that certain endocrine secretions produced by adipose tissue may contribute to the regulation of energy balance1; these secretions also appear to play a role in the physiological mechanisms involved in the genesis of metabolic comorbidities associated with obesity, such as dyslipidemia, hyperglycemia and insulin resistance. Adipose tissue, in addition to its major function as an energy reserve, also acts as an endocrine organ, secreting a number of hormones known as adipokines, including leptin and adiponectin2. Leptin acts at hypothalamic level to regulate satiety and thermogenesis3,4, whilst adiponectin is thought to induce peripheral insulin sensitivity and, possibly, to increase atherogenic protection5,6.
Leptin and adiponectin levels are significantly higher in women than in men5,7,8. This sexual dimorphism would appear to be related not to differences in body fat distribution but rather to differences in sex-hormone levels9,10. Regardless of gender, a positive correlation has been reported between circulating leptin levels and percentage body fat8, whilst adiponectin levels are negatively correlated with both subcutaneous and intra-abdominal fat5.
Serum leptin levels are almost always higher in obese than in non-obese humans, suggesting the existence of a leptin-resistance mechanism possibly involving impaired transport of peripheral leptin into cerebrospinal fluid or desensitization of the signal transduction mechanisms associated with the central nervous system response11-14. Thus, the effects of leptin resistance - perhaps taking the form of increased food intake and decreased thermogenetic activity - may enhance susceptibility to the build-up of body fat, and, consequently, to obesity.
A correlation has been reported between changes in adipokine levels and changes in resting metabolic rate (RMR), a calorimetric variable associated with basal energy expenditure; however, findings in this respect remain controversial2. A link between RMR and obesity-linked metabolic comorbidities such as hyperglycemia has also been noted in subjects with type 2 diabetes mellitus15.
The development of comorbidities has been linked to a number of adipokines including resistin, another adipocyte endocrine factor; a positive correlation has been reported between resistin levels and both glycemia and insulinemia16. Adiponectin also appears to be associated with metabolic disorders characteristic of type 2 diabetes and the metabolic syndrome, a negative correlation being observed between adiponectin levels and both insulinemia and hyperglycemia5,6. Decreased serum adiponectin levels have been reported in subjects with metabolic syndrome, suggesting that adiponectin may be used as a biomarker of this disease17,18.
The evidence, in short, strongly suggests that endocrine factors produced in adipose tissue play a role in the physiological mechanisms involved in the development of metabolic comorbidities associated with the excess build-up of body fat. Therefore, identification of the anthropometric parameters which best help to predict these endocrine changes - taking into account the specific phenotypic features of local populations - may facilitate clinical evaluation of the metabolic alterations associated with obesity. The purpose of this study was to analyze the capacity of a number of anthropometric variables, widely used in estimating the degree of adiposity, to predict changes in serum leptin and adiponectin levels and to ascertain the degree of correlation between adipokine levels and resting metabolic rate, insulinemia, glycemia and lipid profile in overweight and obese women.
Methods
Subjects
A total of fifty-one overweight or obese women (BMI ≥ 25 kg/m2) aged 25 - 60 (mean 41.8 ± 10.7), residing in the city of Novo Hamburgo - RS, Brazil, were included in the study. All subjects met the following inclusion criteria: stable eating habits; not following a low-calorie diet; stable weight (variation of less than 4 kg) over the last three months; stable level of physical activity over the last six months; no use of drugs which might significantly affect weight, appetite, lipid profile or blood glucose levels, over the eight weeks prior to the start of the study; good general state of health. Subjects with the following pathologies, history or current clinical status were excluded: pregnancy or lactation, stopped smoking during the last six months, gastroplasty or any other gastrointestinal weight-reducing surgery, insulin-dependent diabetes, drug-controlled type 2 diabetes and history of endocrine disorders (particularly hypothyroidism).
Study design
This transversal study of a group of overweight or obese women (mean BMI 34.9 ± 6.0 kg/m2) evaluated correlations between serum adipokine (leptin and adiponectin) levels, metabolic variables (insulinemia, glycemia, lipid profile and RMR) and anthropometric data generally used to estimate degree of obesity, i.e. body mass index (BMI), percentage fat mass (%FM) and abdominal fat mass as measured by waist circumference (WC). The predictive capacity of correlated variables was analyzed using a simple linear regression model. In order to better assess the influence of degree of obesity on the other variables, subjects were divided into 4 groups (overweight, obesity 1, obesity 2 and obesity 3), on the basis of BMI19. To verify the suitability of BMI for estimating the degree of obesity, the correlation between BMI, % fat mass and waist circumference was analyzed. Volunteers were selected and analyses performed during 2008. Analyses for each subject took no longer than one week. The study protocol was approved by the Research Ethics Committee at the Centro Universitario Feevale (Novo Hamburgo, RS, Brazil). Informed consent to participation and confidential use of data was given by all subjects.
Anthropometric measurements
In accordance with the protocol developed by the International Society for Advancement in Kinanthropometry, body mass index, height and waist circumference (WC) were measured. Subjects were weighed on a Filizola® balance (accurate to 100 g), height was measured using a Sayol® stadiometer (accurate to 0.1 cm) and circumference was measured with a Fanny® tape measure (accurate to 0.1 cm). Weight and height data were used to calculate the BMI. Two-compartment body composition, %FM and free fat mass (FFM) were measured by tetrapolar bioelectrical impedance analysis in 12-hour-fasted subjects on a restricted physical-activity schedule, using a Bodystat/1500® analyzer, operating at 50 KHz. On the basis of bioelectrical impedance data, FFM was assessed using the equation developed by Deurenberg et al20: FFM (kg) = 0.340 (h2/R) + 0.1534 (h) + 0.273 (BM) - 0.127 (age) + 4.56 (sex) -12.44, where: h = height (cm), R = resistance (Ohms), BM = body mass (kg) and female = 0.
Laboratory tests
Peripheral venous blood samples were obtained from 12-hour-fasted subjects who had not engaged in physical activity or consumed alcohol in the 24 hours prior to sampling. Samples were centrifuged for serum separation (10 minutes at 3500 rpm) and routinely processed: Trinder colorimetric enzyme-based assays were performed using Labtest® laboratory kits (Labtest Diagnóstica SA.) to measure serum glucose, triglyceride (TG), total cholesterol (TC), and HDL-cholesterol levels; the latter was measured prior precipitation of other lipoprotein fractions. LDL-cholesterol was estimated using Friedwald's equation21: LDL = TC -(HDL + TRI/5), for TG < 400 mg/dL (LDL could not be estimated in one subject because [TG] exceeded that limit).
Adipokine levels were measured by enzyme-linked immuno-sor-bent assay, using human leptin and adiponectin Elisa kits® (Linco Research). Outlier results, i.e. results beyond the test linearity range (leptin 0.5-100 ng/mL; adiponectin 0.78-50 μg/mL), were excluded (3 for leptin, 7 for adiponectin). Insulin levels were measured by chemilumines-cent immunoassay (Access Ultrasensitive Insulin Assay Kit®, Beckman Coulter Inc.); the same method was used to measure TSH levels in order to check for hypothyroidism during the subject selection phase.
Resting metabolic rate
Resting metabolic rate (RMR) was assessed by indirect calorimetry, using a TEEM 100® (Inbrasport) calorimeter: 12-hour-fasted subjects on a restricted exercise schedule laid comfortably on their backs in a silent room at a mean temperature of 24 ± 1 oC, and VO2 and VCO2 were recorded over a 15-minute period; data obtained over the last 10 minutes were used to calculate RMR. RMR estimation was based on the Weir equation22: RMR (kcal/min) = [3.9 (VO2) + 1.1 (VCO2)]. The value obtained was multiplied by 1440 in order to estimate RMR for 24 hours. RMR was calculated and presented from the relationship with body mass (kcal/kg/24 h).
Statistical analysis
Results are shown as means ± standard deviation. The Kolmogorov-Smirnov test was applied to test for a normal distribution of variables. Differences between means were analyzed using one-way ANOVA; values of p < 0.05 were considered statistically significant. Scheffé's post-hoc test of ANOVA was also applied. Correlations between variables were measured using Pearson's correlation coefficient. The predictive capacity of correlated variables was analyzed by simple linear regression. All analyses were performed using SPSS 16.0. statistical analysis software.
Results
Body mass index displayed sufficient correlation with both %FM (r = 0.908) and WC (r = 0.823) to justify its use as a measure of degree of obesity. Neither mean glycemia values nor mean lipid-profile variables varied significantly as a function of degree of obesity (table 1). Of the anthropometric variables analyzed, only WC displayed a significant correlation with glycemia (r = 0.483; p = 0.001).
Differences between mean leptin and insulin levels as a function of degree of obesity are shown in table 1 (p < 0.01). Serum levels of both hormones were correlated with all studied anthropometric variables (p <0.001). Additionally, a significant correlation was observed between leptin and insulin levels (r = 0.574; p < 0.001).
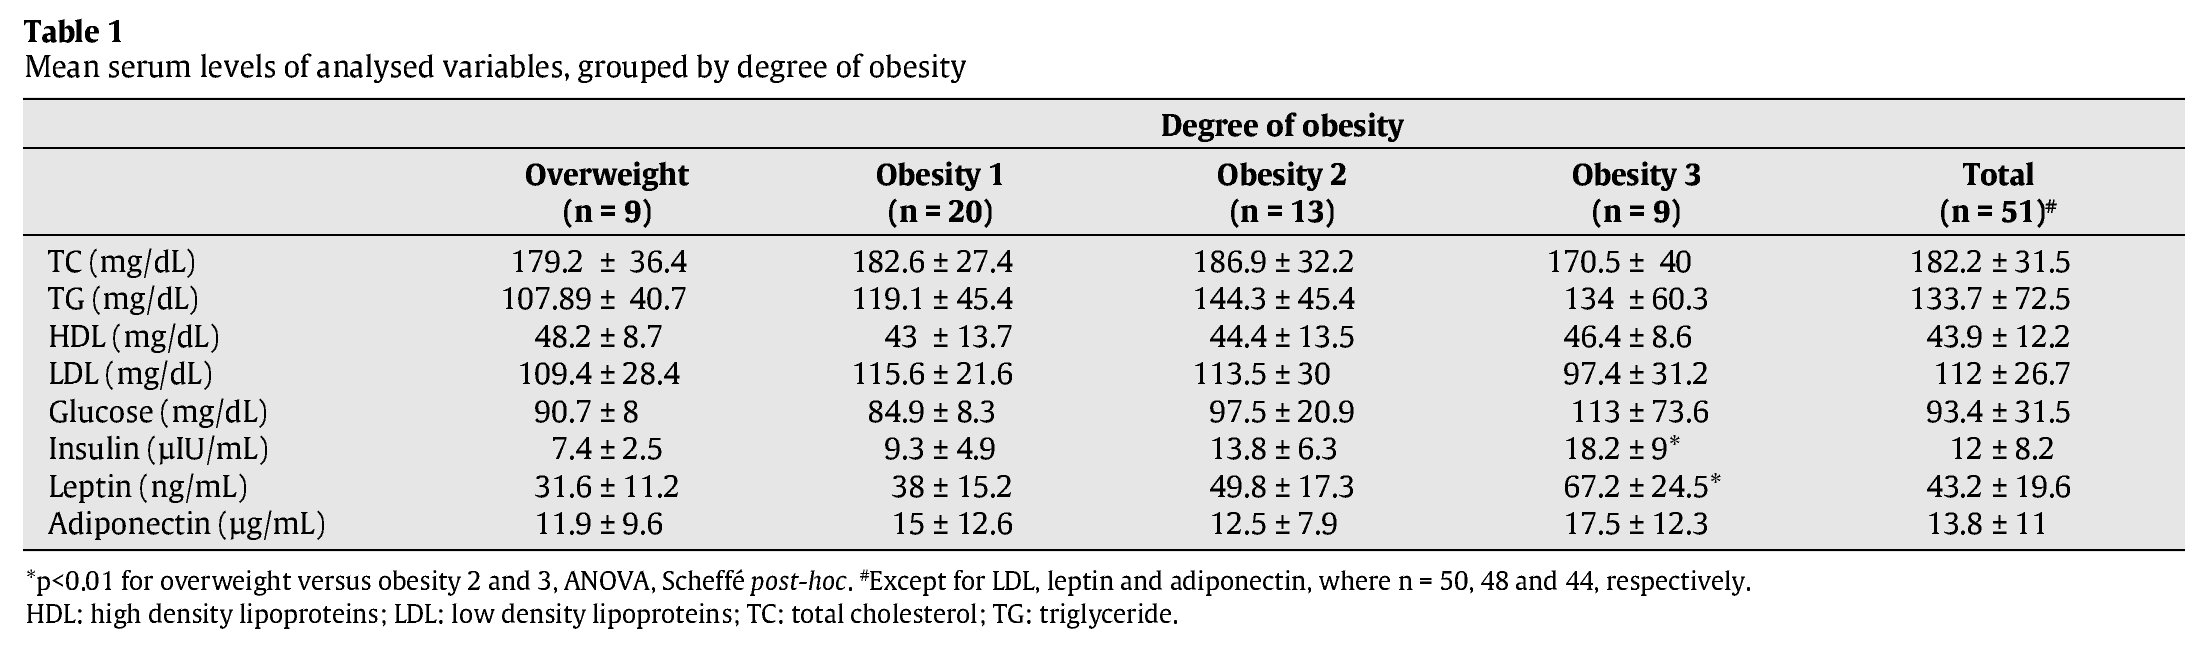
Scatter diagrams for leptin levels plotted against the three anthropo-metric variables studied are shown in figure 1. Using simple linear regression analysis, it was estimated that for each unit of BMI, %GC and WC, leptin levels varied by a mean 2.0 ng/ml (β = 1.990, r2 = 0.365, F = 24.744, p < 0.001), 2.2 ng/ml (β = 2.173, r2=0.334 F=21.584, p<0.001) and 0.9 ng/ml (β=0.892, r2 = 0.237, F = 13.334, p = 0.001), respectively. When considering each variable separately, the mean contribution of BMI, %FM and WC to changes in leptin levels was 36.5, 33.4 and 23.7%, respectively.
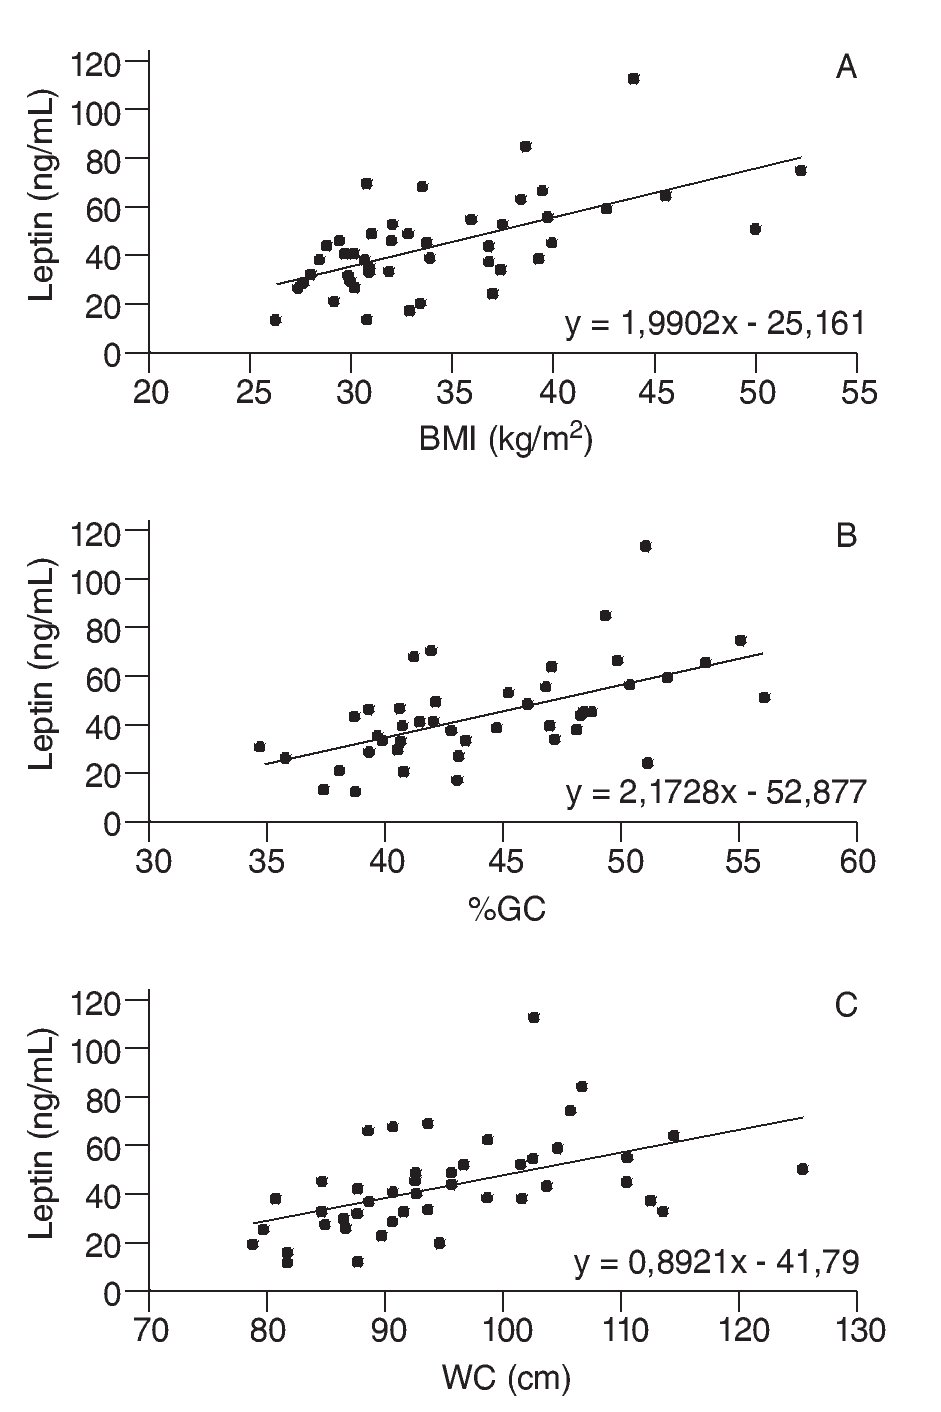
Fig. 1. Scatter diagrams plotting leptin levels against body mass index (BMI) (A), percentage fat mass (%FM) (B) and waist circumference (WC) (C).
A correlation was also observed between leptinemia and triglyceride levels (r = 0.375; p = 0.009), whilst adiponectin levels displayed no correlation with any of the anthropometric or metabolic variables analyzed. Moreover, there was no correlation between serum adipokine levels and RMR, even when these endocrine variables were adjusted to BMI and/or %FM. However, a negative correlation was found between RMR and both %FM (r = -0.328, p = 0.023) and BMI (r = -0.348, p = 0.015), as shown in figure 2.
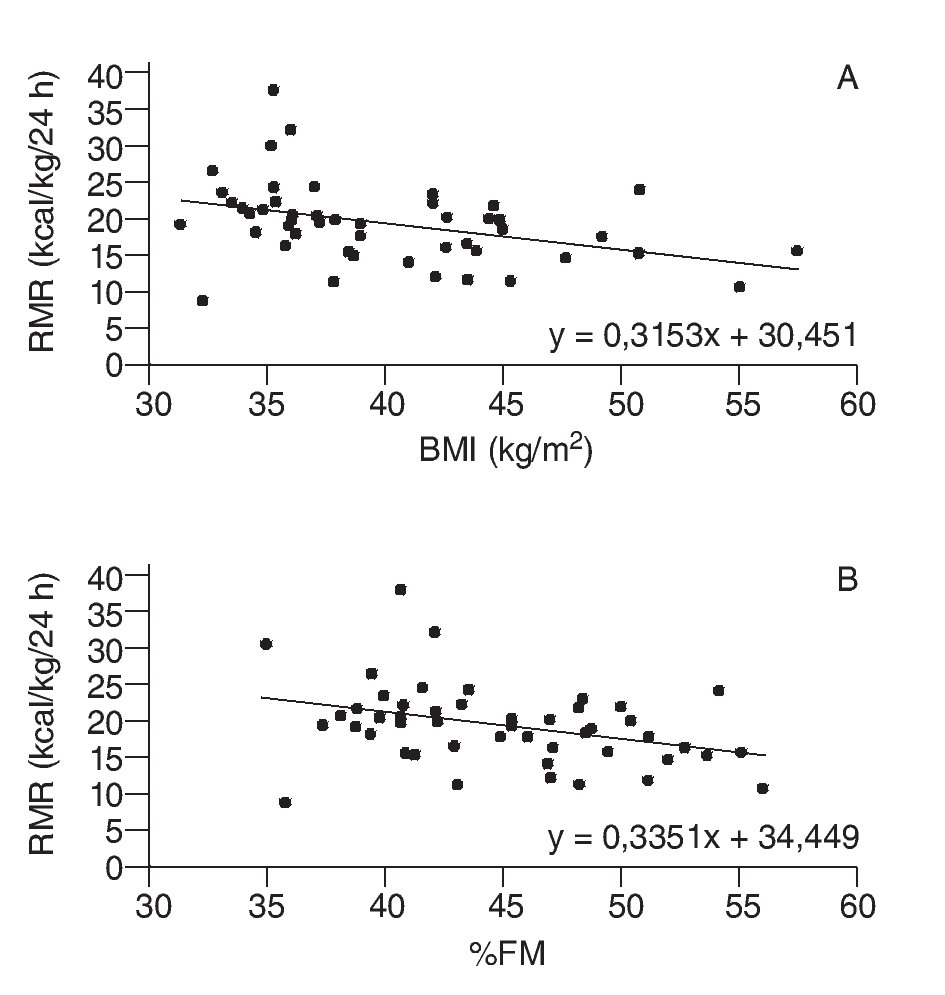
Fig. 2. Scatter diagrams plotting resting metabolic rate (RMR) against body mass index (BMI) (A), and percentage fat mass (%FM) (B).
Discussion
This study demonstrated a significant correlation between leptinemia and the three anthropometric variables studied (BMI, %GC, WC). No correlation was noted between these variables and adiponectin levels, although other studies report a negative correlation between adiponectinemia and degree of obesity6,17. Moreover, no correlation was observed between serum adiponectin levels and either the lipid profile or blood glucose levels. Although a number of authors have suggested adiponectin as a possible biomarker of metabolic syndrome17,18, in the present study group no correlations were found between adiponectin levels and the variables most widely used to characterize metabolic syndrome: WC, TG, HDL-cholesterol and glycemia.
The positive correlation between leptin levels and degree of obesity, suggesting a leptin resistance mechanism, has already been reported in the literature2. The contribution of BMI to changes in leptinemia was similar to that of %FM (around 35% in each case), whereas WC - generally considered a better predictor than BMI for visceral fat and metabolic alterations23 - had less influence on leptin levels (23.7%). Moreover, though apparently good predictors for leptinemia, neither BMI nor %FM were correlated with changes in lipid profile or blood sugar levels. This may be because leptin is more intensely expressed by subcutaneous than by visceral adipose tissue24; BMI and %FM (estimated by bioelectrical impedance) reportedly display a more significant correlation with subcutaneous fat25,26.
Leptin acts as a thermogenic factor, stimulating hypothalamic centers associated with the regulation of basal energy expenditure3,4. It may thus be inferred that leptin resistance decreases the basal metabolic rate, contributing to the energy imbalance characteristic of obesity. A further striking finding in the present study was the negative correlation between RMR, a parameter indicative of thermogenic activity, and both BMI and %FM, suggesting a reduction of energy expenditure in more obese subjects. However, although more obese subjects tended to have higher levels of leptin and lower RMR values, these two variables were not correlated with each other, suggesting that changes in energy expenditure may occur independently of variations in leptin levels. The negative correlation between RMR and both BMI and %FM may simply be due to an increase in the fat mass fraction with respect to the lean mass fraction, especially in the case of muscle mass, which is metabolically more active than fat mass.
BMI, %FM and WC all displayed positive correlations with insulin levels, thus confirming the well-established link between obesity and insulin resistance27. The significant correlation observed between leptinemia and insulinemia may therefore be attributed at least in part to obesity, which contributes to the development of resistance mechanisms to both hormones. A number of studies have suggested that insulin itself may stimulate leptin transcription and secretion1, 28.
From the results obtained, it may be concluded that both BMI and %FM (estimated by bioelectrical impedance) are useful factors for predicting leptin levels in this study population, although neither variable displayed any apparent correlation with adiponectinemia. Whilst leptin levels were correlated with triglyceride levels, levels of the two adipokines were of no value for predicting the other metabolic variables analyzed.
Correspondence:
C.A. Ronconi Vasques.
Instituto de Ciências da Saúde.
Centro Universitário Feevale-Campus II. RS-239, 2755, 93352-000.
Novo Hamburgo - RS, Brazil.
E-mail:
carlosrv@feevale.br
Received April 30, 2009
Accepted May 25, 2009