Introduction
Despite the numerous operations involved during human gait (activation of the central nervous system, transmission of the signals to the muscles, contraction of the muscles, integration of the sensory information, etc.), the way in which humans move appears stable with quite smooth, regular and repeating movements1. Besides, investigations using biomechanical (i.e., kinematics, kinetic and electomygraphic) measures seem to confirm this impression with patterns relatively constant across the gait cycles. However, closer and more careful examinations of the gait patterns highlighted complex fluctuations over time, the patterns never repeating exactly as themselves2-4. Until recently, these variations were considered as noisy variations, resulting from some random processes. However, recent literature from different scientific domains has shown that many phenomena previously described as noisy are actually the results of nonlinear interactions and have deterministic origins, conveying important information regarding the system behavior5-7.
Therefore, arrays of investigation have been conducted to characterize and understand the complex fluctuations observed in gait2-4,8-17. Using tools from nonlinear dynamics, these studies demonstrated that this complexity is responsible for the flexible adaptations to everyday stresses placed on the human body during gait. They also established a link between the alterations of this complexity and the unhealthy states in gait. Therefore, the aim of this review is to present, in the more exhaustive manner as possible in view of the space constraints, the progresses made recently about the understanding of the complexity in the human gait.
The first section of the review is dedicated to the definition and the function of complexity using well-known physiological rhythms. The second section is interested in normal gait, investigating its complexity through the most commonly used nonlinear parameters. In a third section the relationship between gait complexity and unhealthy states is presented. Then, in a last section, some models of gait complexity, with an emphasis on the possible neural mechanisms responsible for this complexity, are presented.
What is complexity?
Like the beating of the heart, the cycles of the respiration or the impulses of the nerve cells, bodily rhythms are ubiquitous in humans and central to life6,18-20. Accordingly, they have been coming under increasingly closer examination. A common finding is that these rhythms are rarely strictly periodic, but rather complex, fluctuating in an irregular way over time (nice illustrations of complex human rhythms are available in Glass20). The most interesting fact is that these irregular fluctuations, initially viewed as the result of some stochastic (noisy) processes6, were recently found to have deterministic origins. Results obtained from experiments investigating beat-to-beat intervals of the human heart, the so-called R-R intervals, are perfect illustrations of such determinism. Anybody who listen the beats of the heart feels that the rhythm is regular with a roughly constant R-R interval between the beats. However, using techniques from nonlinear dynamics which will be detailed next, studies highlighted that the R-R intervals varied over time (fig. 1), and more interesting, proved that the R-R interval at any time depends on the R-R interval at remote previous time21-26. The irregular fluctuations in the beating of the heart, which appear first to be erratic, are then fully deterministic, this "constrained kind of randomness" meaning that the heart dynamics (i.e., its behavior over time) is chaotic. Hence, the concept of complexity for which we take major interest in the present work is profoundly connected with the one of chaos and can be defined, as proposed by Stergiou et al27, as the irregular (variable) fluctuations that appear in physiological rhythms which take the form of chaos.
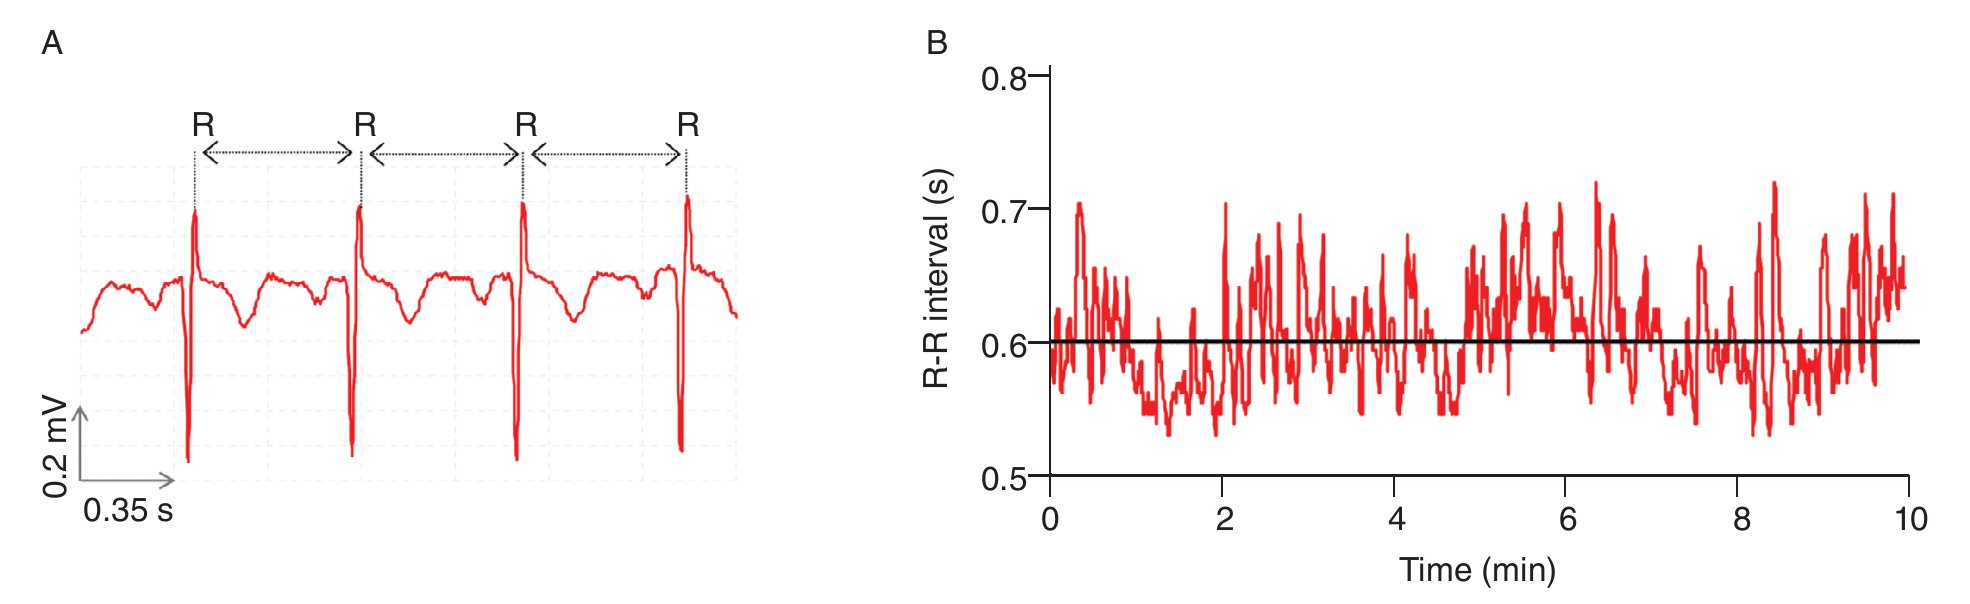
Fig. 1. Heart time series. A. An electrocardiogram (ECG) record, representing the electrical activity of the heart over time. The R-R interval represents the time duration between two consecutive R waves. B. R-R interval time series. Even though the interval is fairly constant, it fluctuates about its mean (solid line) in an apparently erratic manner. The data used for the traces A. and B. were obtained from the free web resources available on Physionet (http://www.physionet.org).
Considering now that bodily rhythms are complex in the sense that they display chaotic fluctuations over time, an interesting question is the one of the function of complexity. Numerous studies suggested that the chaotic temporal variations represent capabilities to make flexible adaptations to everyday stresses placed on the human body21,25,28. A reduction or deterioration of the chaotic nature of these temporal variations represents a decline in the "healthy flexibility" that is associated with rigidity and inability to adapt to stresses21,25,28. Findings from experiments in cardiology illustrate again such phenomenon. While either random or periodic (i.e., constant) variations in the R-R interval of the heart beat are associated with disorders, chaotic heart rhythms are related to healthy states (e.g., Goldberger et al28). Using the above idea as a foundation, Stergiou et al27 have proposed a model to explain the rhythms complexity as it relates to health. In this theoretical model, greater complexity is characterized by chaotic fluctuations and is associated with a healthy state of the underlying system while lesser amounts of complexity are associated with both periodic and random fluctuations where the system is either too rigid or too unstable (fig. 2). Both situations characterize systems that are less adaptable to perturbations, such as those associated with unhealthy states. The notion of predictability has also been implemented in the model, mainly to differentiate between the random and periodic rhythms. Indeed, low predictability is associated with random and noisy systems, while high predictability is associated with periodic highly repeatable and rigid behaviours. In between is chaotic, highly complex, based-behaviours where the systems are neither too noisy nor too rigid (fig. 2). Therefore, the complex fluctuations of the human rhythms are intrinsic and vital to the operation of the underlying systems, a deterioration of complexity being harmful to their operation.
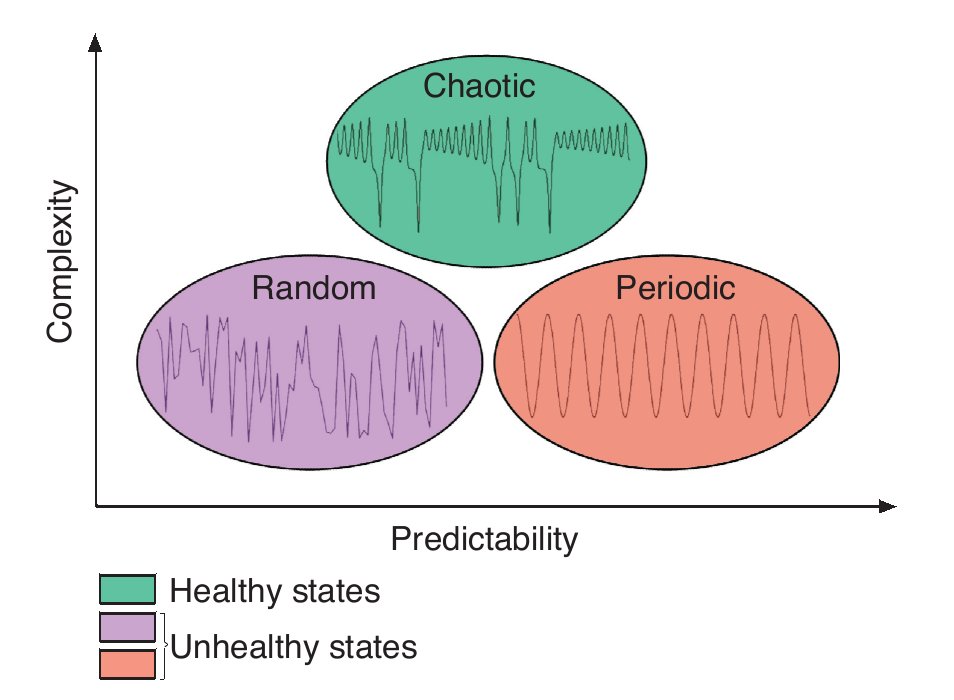
Fig. 2. Theoretical model of complexity as it relates to health. Adapted from Stergiou et al27.
Directly related to the previous concerns is the human gait. Indeed, human gait is also rhythmic by nature, involving repeatable motions of the joints and successive step and stride cycles. Accordingly, does such a rhythmic activity also characterized by some complex (chaotic) fluctuations? And if the fluctuations are chaotic, is there some reasons to believe that their alteration reflect unhealthy states? Studies bring significant answers to these interrogations.
Complexity of the human gait
To investigate the complexity of the human gait, many investigations have examined whether the rhythms related to human walking, such as the linear or angular rhythmical motions of the joints and the stride-time interval, display chaotic fluctuations over time using two different kinds of analyses based on a) state space examination and b) self-similarity evaluation2-4,8-14.
State space examination
The state space analysis represents a technique which consists in representing the dynamics of the joint movements in an abstract, multi-dimensional space, where the coordinates represents simply the values of some state variables characterizing the joint4,29-31. In such a space, the set of all possible states that can be reached corresponds to the phase space. The sequence of such states over the time-scale defines a curve in the phase space called a trajectory and as time increases, the trajectory converges towards a low-dimensional indecomposable subset called an attractor which gives information about the asymptotic behaviour (periodic, chaotic or random) of the joint4. However, since one cannot measure experimentally all the components of the vector characterizing the state of the joints, the authors have reconstructed the state space from one-dimensional joint kinematics data sets, by using the time delay method derived from the Takens' embedding theorem32,33. Specifically, different scalar kinematics measures were used to reconstruct state space including joint angles4,34, linear joints displacements or accelerations12,14,35-37 and Euler angles at the joints38. Hence, given a time series (fig. 3A)

of N kinematics joint data sampled at equal time intervals, the recons, tructed attractor consists of a set of m-dimensional vectors ν i , i = 1, ..., N - (m-1)τ of the form

where τ is the time delay, chosen to maximize the information content of χ i , and m the embedding dimension that must be large enough to "unfold" the attractor (fig. 3B). Choice of the delay was generally accomplished by looking for the first minimum of the average mutual information function39 whereas the embedding dimension was selected where the percentage of the global false nearest neighbours approached zero40. Despite variations in the kinematics parameters used to reconstruct the state pace as mentioned above, all highlighted appropriate embedding dimensions higher than two (most of time around five), indicating that the attractors underlying the joints movements during human walking exceed a periodic attractor, converging possibly towards a strange attractor and suggesting that the observed movement's patterns fluctuate over time in a chaotic way3,12-14.
![fig. 3. state space analysis in human gait. a. a one-dimensional joint kinematics data set which is the hip angle over time in the saggittal direction. b. reconstruction of the state space from the time series using the time delay method. for convenience, the state space is presented here with three embedding dimensions. [xi, xi+r, xi+2r] preferred states are visited in the space, corresponding to the attractor. note that one complete orbit around the attractor constitutes one cycle of movement. c. local section of the attractor where the divergence of neighbouring trajectories across i discrete time steps is measured by dj(i). the largest lyapunov exponent λ1 is then calculated from the slope of the average logarithmic divergence of all pairs of neighbouring trajectories (ln[dj(i)]) versus i.Δts. d. evaluation of the way in which the number of points within a sphere of radius r centred on the attractor scales with r. as the number of points, c(r), increases as a power of r, the correlation dimension dc is then calculated from the slope of the ln/ln plot of c(r)vs.r. the hip kinematics data were obtained from resources of the nebraska bio-mechanics core facility (university of nebraska at omaha).](/ojs/public/elsevier/imagenes/Complexity%20and%20Human%20Gait/284v03n01-13147799fig8.jpg)
Fig. 3. State space analysis in human gait. A. A one-dimensional joint kinematics data set which is the hip angle over time in the saggittal direction. B. Reconstruction of the state space from the time series using the time delay method. For convenience, the state space is presented here with three embedding dimensions. [xi, xi+r, xi+2r] Preferred states are visited in the space, corresponding to the attractor. Note that one complete orbit around the attractor constitutes one cycle of movement. C. Local section of the attractor where the divergence of neighbouring trajectories across i discrete time steps is measured by dj(i). The largest Lyapunov exponent λ1 is then calculated from the slope of the average logarithmic divergence of all pairs of neighbouring trajectories (ln[dj(i)]) versus i.Δts. D. Evaluation of the way in which the number of points within a sphere of radius r centred on the attractor scales with r. As the number of points, C(r), increases as a power of r, the correlation dimension Dc is then calculated from the slope of the ln/ln plot of C(r)vs.r. The hip kinematics data were obtained from resources of the Nebraska Bio-mechanics Core Facility (University of Nebraska at Omaha).
Moreover, different index looking at the structure of the attractors were also calculated to strengthen the presence of chaos in gait, including the largest Lyapunov exponent (λ1) and the correlation dimension (DC), the former measuring the average exponential rate of divergence of neighbouring trajectories of the attractor29,41 and the latter the way in which the attractor's geometry varies over many orders of the attractor's length scales42,43. Technically, λ1 is calculated in gait using the algorithm developed by Rosenstein et al41, which applies well to time series of finite length, following:

where Δt is the sampling period of the time series and dj (i) is the Euclidean distance between the jth pair of nearest neighbours after i discrete-time steps, i.Δt s. Euclidean distances between neighbouring trajectories are calculated as a function of time and averaged over all original pairs of nearest neighbours. The λ 1 is then estimated from the slope of the linear fit to curve defined by:

where<.> denotes the average over all values of j (fig. 3C). On the other hand, the correlation dimension is estimated by measuring how the average number of points within an (hyper) sphere of radius r centred on the attractor scales with r, based on the calculation of the correlation integral44:
and vi , vj are the vectors previously defined in equation 2. For small values of r, the correlation integral behaves as a power of r, so that C(r)∞ rDc. Hence:

and Dc is then obtained by extracting the slope of the ln/ln plots of C(r) vs. r (fig. 3D). In line with the results from the embedding dimensions, the λ 1 and DC values picked out through the literature are systematically positive and higher than one3,12,14,35,36, reinforcing the idea that a "low-deterministic" chaos is present in the gait data.
However, even though previous results strongly favour a chaotic nature of the fluctuations present in the gait patterns, all are hindered by the fact that the identification of chaos in time series is a very difficult process since purely random signals can mimic chaos and have sometimes been misdiagnosed as chaotic or vice versa45,46. Thus, methods known as surrogate analyses have been used in gait to prevent such misdiagnoses3,4,14,47. Technically, these analyses consist in the creation of a random counterpart of the original data, by destroying its nonlinear structure. This counterpart is then embedded in an equivalent state space as the one of the original time series and similar topological parameters as those obtained from the original time series are calculated (e.g.,λ1 and DC). Accordingly, differences in the parameters evaluated from the original data set and its surrogate counterpart indicate that the fluctuations over time in the original data are veritably chaotic and not randomly derived. The surrogate algorithms of Theiler et al46 and Theiler and Rapp48 has been used in the past and related results support the notion that fluctuations in human gait have a deterministic pattern2,3,14. However, these algorithms have been shown of limited utility when applied to time series with strong pseudo-periodic behaviours as it is the case in gait (see fig. 3A and 3B). Thus, Small et al49 have consequently proposed another algorithm, the so-called pseudo-periodic surrogate (PPS) algorithm, to preserve such periodicities (i.e., to preserve intra-cycle dynamics while destroying inter-cycle dynamics). In a recent work conducted on gait data, Miller et al47 showed that both algorithms attest for the presence of chaotic fluctuations in gait, with more robust and suitable results using the PPS algorithm. Hence, using methods related to state space examination, the fluctuations in the gait patterns have been found to be chaotic, demonstrating the complexity of the human gait.
Self-similarity evaluation
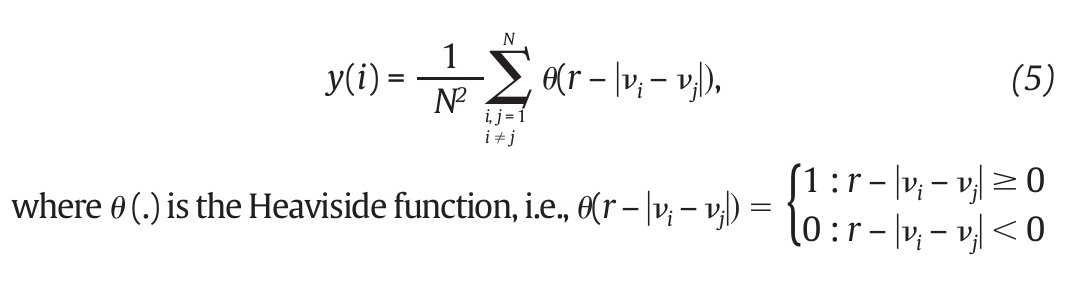
The complexity of the human gait has also been evaluated using methods that evaluate the self-similarity of the time series, by examining the presence of repetitive patterns in their fluctuations over time. Among these methods, two have been extensively used in the gait literature: the Approximate Entropy and the Detrended Fluctuation Analysis. The Approximate Entropy (ApEn) is strictly speaking a "regularity statistic" that quantifies the unpredictability of fluctuations in a time series and reflects the probability that similar patterns of observations will not be followed by additional similar observations50,51. This means that a time series containing many repetitive patterns has a relatively small ApEn value, while a less predictable (i.e., more complex) time series has a higher ApEn value. In human gait, computation of the ApEn has been done from kinematics data including joint angle time series4,47,52 and step count values53. Specifically, the computation of ApEn, better identified as ApEn(N,r,m), requires a time series consisting of N kinematics data (as the one defined in equation 1 and two additional input parameters, m and r, the former specifying the pattern length window and the latter a criterion of similarity. Note that a value of two data points for m and a value of 0.2 times the time series standard deviation for r were used in gait studies. Hence, a vector pm (i) is denoted as a subsequence (or pattern) of m kinematics data, beginning at measurement i within the N input data points. Two patterns, pm (i) and pm (j), are similar if the difference between any pair of corresponding measurements in the patterns is less than r. Considering now the set of all patterns of length m [i.e., pm (1), pm (2),..., pm (N - m - 1)] within the N data points, it is possible to define

where nim (r) is the number of patterns in Pm that are similar to pm (i). The quantity Cim (r) corresponds to the fraction of patterns of length m that resemble the pattern of the same length that begins at interval i. Cim (r) is
then calculated for each pattern in Pm and the quantity Cm (r) is defined as the mean of these Cim (r) values. The quantity Cm (r) expresses then the prevalence of repetitive patterns of length m in the N data points. Finally, the approximate entropy of the N data points, for patterns of length m and similarity criterion r, is defined as the natural logarithm of the relative prevalence of repetitive patterns of length m compared with those of length m+1 as follows:

In gait, the ApEn values obtained from joint kinematics and step count values were found generally in the range [0.1-0.2]4,47,52,53, which corresponds to small values given the fact that the ApEn algorithm generates numbers ranged from 0 (periodic data) to 2 (random data)50. Accordingly, the probability that similar patterns are followed by additional similar patterns in the gait time series is high, reflecting a high level of predictability. Despite such results would seem to prove that chaotic fluctuations are present in the gait patterns, an important point which needs to be mentioned here is that ApEn is not genuinely able to dissociate between chaotic and random fluctuations of the gait patterns. To counter such a limitation, Miller et al47 have also applied surrogation techniques to their ApEn calculations and obtained ApEn values from the surrogated gait data (both Theiler and PPS algorithms) larger than the original ApEn values, concluding on the presence of subtle chaotic fluctuations that appear in gait.
The Detrended Fluctuations Analysis (DFA) represents a modification of classic root mean square analysis of random walk and evaluates the presence of long-term correlations within the time series, which correspond to a statistical dependence between fluctuations at one time scale and those over multiple time scales2,54. In human gait, the authors have considered time series of stride-time interval2,8,9,55 and step width56. Methodologically, the series x(t) of N data points is first integrated by computing for each t the accumulated departure from the mean of the whole series:

This integrated series is divided into non-overlapping intervals of length n. In each interval, a least squares line is fit to the data (representing the trend in the interval) (fig. 4A and 4B). The series X(t) is then locally detrended by substracting the theoretical values Xth(t) given by the regression. For a given interval length n, the characteristic size of fluctuation for this integrated and detrended series is calculated by:

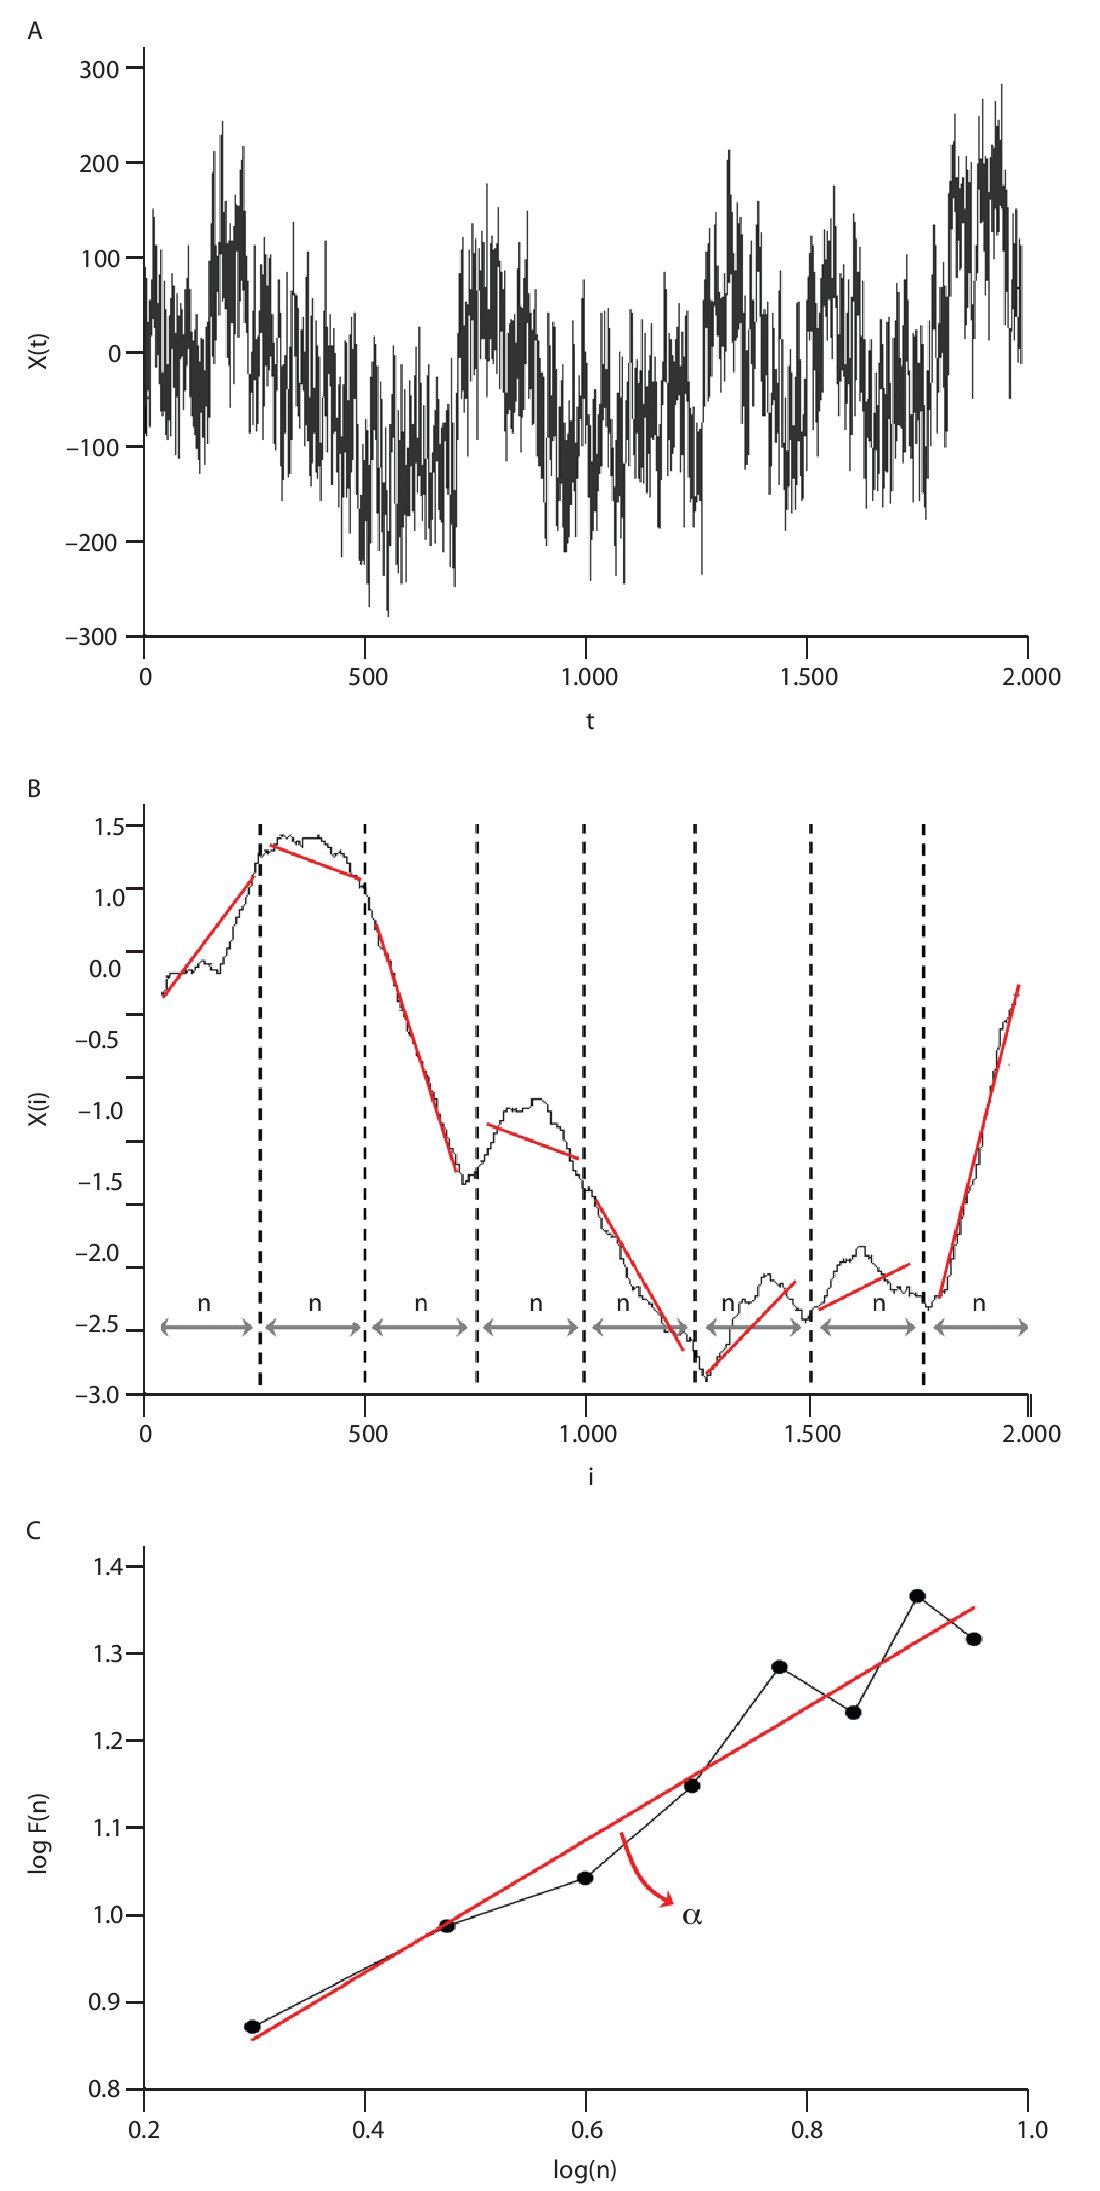
Fig. 4. Illustration of the detrended fluctuation analysis (DFA). A. The original time series. B. The original times series is integrated and divided into non-overlapping intervals of length n. In each interval, a least squares line is fit to the data and the series is locally detrended by substracting the theoretical values given by the regression. The characteristic size of fluctuation F(n) for the integrated and detrended series is then obtained. C. Once the previous computation is repeated over all possible interval lengths, a power law between F(n) and n is expected. The scaling exponent α is then expressed as the slope of a double logarithmic plot F(n) of as a function of n.
This computation is repeated over all possible interval lengths (in practice, the shortest length is around 10 data points, and the largest N/2, giving two adjacent intervals). Typically, F(n) increases with interval length n. A power law is expected, as

where α is the scaling exponent, or self-similarity parameter. α is then expressed as the slope of a double logarithmic plot of F(n) as a function of n (fig. 4C), and can vary between 0 and 1.5. Especially, when α is 0.5, the original series was generated by an independent random process (white noise) and if α is higher than 0.5 and lower than or equal to 1, the series is characterized by long-term correlations and self-similarity. Looking at the stride-time interval, Hausdorff et al2 observed α values around 0.75 indicating that fluctuations in the interval are, on average, related to variations in the interval hundreds of strides earlier in a scale-invariant manner, so-called fractal manner. These long-term correlations in the stride-time interval were found again in another work looking at subjects who walk for one hour at preferred, slow and fast paces with an averaged α value of 0.958. Subsequent studies reiterated these findings in normal walking and running investigating the stride-time interval57-59 or new input data as time series of step width56. The fluctuations of the stride interval and the step width in human gait are then structured rather than random over time. This "long-memory process", with each value depending upon the global history of the series, reinforces again the chaotic character of the human gait.
In sum, all the studies using state space examination and self-similarity evaluation tools stress the fact that normal human gait is intrinsically chaotic and according to our definition of complexity is highly complex, providing flexibility to adapt to perturbations that occur during displacement. The next section will examine how such complexity in human gait evolves with health- and disease-related aging.
Relationship between gait complexity and health- and disease-related aging
State space examination
Several researchers evaluated the effect of aging on gait complexity. A striking example of such studies is the one by Buzzi et al14, in which the authors investigated the nature (organization) of gait variability present in elderly and young women. Based on the assumption that aging may lead to changes in motor variability, the authors used nonlinear state space examination tools (largest Lyaunov exponent λ1 and correlation dimension DC) to compare kinematic variables between the two age groups. Thirty gait cycles (i.e., 8-min data collection) were recorded, allowing the examination of an average of 2,441 data points for each variable. The selected kinematic variables were the hip, knee, and ankle y-coordinates (vertical displacement) and the relative knee angles. The elderly exhibited significantly larger λ1 values (hip: 0.22 vs. 0.18, knee: 0.14 vs. 13, ankle: 0.10 vs. 0.08, knee angles: 0.15 vs. 0.11) and DC values (hip: 3.44 vs. 3.02, knee: 3.54 vs. 2.94, ankle: 3.35 vs. 2.89, knee angles: 2.63 vs. 2.35) than the young for all parameters evaluated indicating more divergence in the movement trajectories along with more degrees of freedom at each joint. An additional observation from the results is that the λ1 increased from the ankle toward the hip, which can be due to the ground restriction at the lower end and thus, decrease in the available degrees of freedom. The knee and particularly the hip are also associated with a greater amount of musculature, thus producing an increasing variety of movements (i.e., increased degrees of freedom available at these joints). The authors hypothesized that the elderly exhibit more noise (i.e., less complexity as described in our model) in their gait patterns, likely explaining the higher incidence of falls in the elderly.
Other researchers seek to understand how individuals compensate for a disease. For instance, Dingwell et al12 investigated the effect of diabetic neuropathy on the lower extremity joint angles and the triaxial accelerations of the trunk collected during a 10-min walk at self-selected pace. The results showed that neuropathic patients exhibited smaller λ1 values in comparison with matched healthy controls (mean λ1: ~ 0.03 vs. ~ 0.04, respectively). These patients also exhibited slower walking velocities (mean velocity: 1.24 m.s-1 vs. 1.47 m.s-1, respectively). This latter finding was explained as a compensatory strategy to maintain dynamic balance. More recently, Myers et al60 investigated the limitations caused by peripheral arterial disease, a chronic obstructive disease of the arteries of the lower limb caused by atherosclerosis. The resultant decrease in blood flow can result in symptoms of pain in the lower limb on exercise known as intermittent claudication. Exercise induced pain is experienced in the calves, thigh or buttocks restricting activities of daily living and thus reducing quality of life. These limitations are more pronounced in older patients, making them more prone to falls, possible need for nursing home placement and subsequent loss of functional independence. In this study, the authors examined whether the largest Lyapunov exponent, a measure of the sensitive dependence on the initial conditions, has clinical potential as a tool for early detection and/or prediction of the onset of peripheral arterial disease (PAD). For this purpose, joint angle variability of the lower extremities was evaluated in claudicating patients as compared with matched controls during treadmill walking. Participants walked for three minutes or until the onset of claudication, whichever came first. Each joint angle time series included at least 30 strides before the onset of claudification. PAD patients had significantly higher λ1 for all joints compared with controls (hip: 0.095 vs. 0.078, knee: 0.098 vs. 0.074, ankle: 0.105 vs. 0.078, respectively), indicating increased randomness in their gait patterns and loss of motor control. Interestingly, these differences in λ1 values were observed in the pain free condition, meaning that pain itself was not the source of increased divergence in the lower extremity movement trajectories. Most likely, the altered kinematic strategy for the control of gait reflects a combination of myopathy and neuropathy. The nature of these myopathic and neuropathic changes and the way they are associated with the clinical and biomechanical findings of leg dysfunction may hold the key to understanding the PAD pathophysiology.
Self-similarity evaluation
Approximate entropy
Kurz and Stergiou61 used the statistical concept of entropy to explore the certainty present in the lower extremity joint kinematics during gait. Specifically, their study addresses the question of whether the neurophysiological changes associated with aging hinder the ability of the nervous system to appropriately select neural pathways for a stable and functional gait. The results supported the authors' hypothesis that aging is associated with less certainty in the neuromuscular system for selecting joint kinematics during gait. They speculated that less certainty may be due to neurophysiological changes associated with aging. Such neurophysiological changes can result in inaccurate information from the visual, vestibular, and somatosensory receptors (proprioceptive, cutaneous, and joint receptors). Thus, the aging neuromuscular system may not receive appropriate information to be certain that the selected kinematic behavior will provide a stable gait. Such uncertainty may be responsible for the increased probability of falls in the elderly.
Later, Khandoker et al62 applied ApEn for variability analysis of minimum foot clearance (MFC) data obtained from healthy elderly and falls-risk elderly (i.e., with balance problems and a history of falls). Minimum foot clearance, which occurs during the mid-swing phase of the gait cycle, has been identified as a sensitive gait variable for detecting change in the gait. In fact, at the MFC event, the foot travels very close to the walking surface (i.e., mean MFC height is approximately 1.29 cm) and even closer as individuals age (~ 1.12 cm). A decreased mean MFC height combined with its variability provides a strong rationale for MFC being associated with the risk of tripping and/or losing balance. Participants completed about 10 to 20 minutes of self-paced walking. For each participant, a dataset of 400 adjacent MFC points was used. Each dataset was divided into smaller sets of length (m = 2), thus creating 200 smaller subsets. Then, the number of subsets that are within the criterion of similarity (i.e., 0.15 of the standard deviation of 400 MFC points) was determined. The same process was repeated for the second subset till each subset was compared with the rest of the dataset. The results reveal that ApEn, used with m = 3, in falls-risk elderly (i.e., mean ApEn = 0.18) was significantly higher than that in healthy elderly (i.e., mean ApEn = 0.13), indicating increased irregularities and randomness in their gait patterns and an indication of loss of gait control. Interestingly, mean MFC was also higher in falls-risk elderly, supporting the authors' hypothesis that increasing MFC height could be a strategy to minimize tripping, and therefore risk of falling. MFC variability, as assessed by ApEn, could potentially be used as a diagnostic marker for early detection of falls risk in older adults.
Lately, Cavanaugh et al53 explored the natural ambulatory activity patterns of community-dwelling older adults. Using a step activity monitor, the ambulatory activity data (i.e., series of one-minute step counts) were collected continuously (24 hours per day) for two weeks. Each series of one-minute step counts contains a two-dimensional temporal structure: (a) a vertical structure composed of one-minute step count values of varying magnitude, and (b) a binary horizontal structure composed of minutes containing either some activity (step count > 0) or no activity (step count = 0). Fluctuations in the vertical and horizontal structures form a unique pattern that reflects the individual's ambulatory activity pattern. Participants were divided into three groups based on the mean number of steps per day: highly active (steps ≥ 10,000), moderately active (5,000 ≤ steps ≤ 10,000 steps), and inactive (steps < 5,000 steps). ApEn was one of the nonlinear measures used to examine the complexity of daily time series composed of one-minute step count values. Specifically, ApEn determined the probability that short sequences of consecutive one-minute step counts repeated, at least approximately, throughout the longer temporal sequence of 1,440 daily one-minute intervals. The authors used a short sequence length of 2 and a criterion of similarity of 0.2 times the standard deviation of individual time series for all participants. The results highlighted the unpredictability of minute-to-minute fluctuations in activity of highly active participants and the relative greater regularity in the activity patterns of less active participants. Specifically, highly active participants displayed greater amounts of uncertainty (i.e., mean ApEn = 0.50) in the vertical structure of the step count time series than either moderately active (i.e., mean ApEn = 0.40) or inactive participants (i.e., mean ApEn = 0.28). Given the fact that step count data demonstrated a deterministic pattern, greater uncertainty was interpreted as greater complexity. Therefore, the authors inferred that a higher level of activity might be associated with an enhanced ability to adapt walking behaviour to sudden changes in task demands or environmental conditions, an important feature of healthy aging. This study provided a field-based methodological approach that offers an "ongoing view" of walking, that is, an opportunity to study the manner in which an older adult interacts naturally with the customary environment, beyond the splotlight of the clinical and laboratory settings.
Detrended Fluctuation Analysis
Hausdorff et al2,8 observed that the gait of healthy young adults exhibits long-range, self-similar (fractal) correlations. The authors collected stride time intervals during overground walking using force sensitive switches, and analyzed them using the Detrended Fluctuation Analysis. They found that the scaling exponent (i.e., a measure of the degree to which a stride interval at a given time scale is correlated with previous and subsequent stride intervals over different time scales) is α = 0.76 in self-paced conditions. Interestingly, the scaling exponent α remained relatively constant (α ranging from 0.84 to 1.10) in slow and fast paced conditions. Subsequent studies supported these findings, demonstrating that the fractal property of the fluctuations in the stride interval is also present during treadmill walking or running57-59. From a neurophysiological control viewpoint, it appears that the presence of long-term, dependence (or "memory" effect) in gait is intrinsic to the locomotor control system and exist for a wide range of gait velocities. Another study compared the stride interval fluctuations of healthy elderly (i.e., free of underlying disease) vs. young adults9. The scaling exponent α was significantly lower in the elderly compared to the young (α = 0.68 vs. 0.87, respectively), indicating a loss of long-range correlations with aging. Although α differed in the two age groups, the traditional measures (mean and coefficient of variation of stride time intervals) were not altered with age. Therefore, it appears that the DFA scaling exponent α is a sensitive measure able to detect even subtle age-related changes in locomotor function.
In the effort to characterize the biological "clock" that controls locomotion, Hausdorff et al8 examined fluctuations in the stride interval during metronomically-paced walking. Healthy young adults walked in time with the metronome's beat set to the subject's natural stride time interval. The metronomic conditions breakdown the typical long-range correlations of the stride intervals typically found in self-paced walking, meaning that successive stride intervals became uncorrelated. The authors explained this breakdown by suggesting that supraspinal influences (i.e., locomotor pacesetter above the level of the spinal cord) could override the normally present long-range correlations generated peripherally. In other words, the intervention of attentional and intentional processes focused on external pacing would provoke a kind of "over-simplification" of the system, yielding the deterioration of long-range correlation in stride interval fluctuations. However, Delignière and Torre63 recently re-examined Hausdorff et al's data and showed that in metronomic conditions stride intervals cannot be considered as uncorrelated, but rather, contained anti-persistent correlations (0.34 < α < 0.41). The authors concluded that the intrinsic complexity of the system is still at work in metronomic conditions, but expresses differently in overt performance. According to them, the presence of long-range dependencies in stride time intervals is determined by a central timekeeper possessing fractal properties. In metronomic conditions, an autoregressive correction process would control the discrepancy between the periods produced by this timekeeper and those imposed by the metronome.
To gain insight into the basis of the presence of long-term dependence, Hausdorff et al9 investigated the effects of a neurodegenerative condition, the Huntington's disease, on long-range correlations in stride time fluctuations. The rationale behind the study of patients with Huntington's disease is that they are generally adults between 30-40 years old with impairment limited primarily to the central nervous system (i.e., free of other comorbidities and peripheral disease), thus providing a "contrast" to aging to better understand the mechanisms underlying the existence of stride-interval correlations. Most of the Huntington's disease-related changes have been observed in the basal ganglia, with a loss of striatal projection neurons. Reduced stride-interval correlations were observed for the patients with Huntington's disease (α = 0.60) compared with healthy controls (α = 0.88), indicating the apparition of an "unhealthy", uncorrelated (or anti-persistent) dynamics. Besides, among the patients with Huntington's disease, α was inversely correlated with disease severity. The authors suggested that the striatal pathology (that leads to a decrease in fine motor control) might also impair the long-term dependence and fine control required for stride-interval correlations. Collectively, these results lay emphasis on the importance of the central nervous system in the generation of the fractal property of gait.
More recently, Hermann et al64 investigated whether the scaling exponent α could be used as a predictor of falls in older adults with a higher-level gait disorder that is an altered gait that is not a result of lower extremity or peripheral dysfunction and cannot be attributed to well defined chronic disease (e.g., idiopathic "cautious" gait of the elderly65). Among these patients, all measures (of muscle function, balance, and gait, including gait speed and stride time variability) were similar in fallers and non-fallers (including fear of falling). Only the scaling exponent α was significantly decreased in fallers (i.e., α = 0.75 in fallers vs. 0.88 in non-fallers), indicating that the walking pattern of the fallers was more random and spatio-temporally less organized. Changes in the temporal ordering of the stride interval pattern in fallers have been suggested to reflect changes in specific cognitive domains. Hausdorff et al66 demonstrated that, to a large degree, the cognitive profile of fallers is similar to that of patients with Parkinson's disease (PD), with prominent deficits in executive function and attention. However, unlike PD patients, fallers were abnormally inconsistent in their response times when performing a Go/No-go response inhibition paradigm. Using sensitive neuroimaging techniques, Bellgrove et al67 found that those individuals with increased inconsistent response times activate inhibitory regions to a greater extent, perhaps reflecting a greater requirement for top-down executive control. Collectively, these findings suggested that fallers may have damage to specific neural networks, in particular those subserving executive function and attention.
Modeling gait complexity
Complexity in human gait has also been considered from a modelling standpoint in order to gain insights into the origins of the chaotic dynamics2,17,68-71. Indeed, even if studies well-established that chaos relates to flexibility in gait, generating stable and variable patterns, they did not bring information about the principles that govern such a chaotic aspect. Within this line of research, different efforts have then been made to identify quite simple models (also called templates72) able to reproduce chaos, and, more interesting, which can be used to investigate how chaos in gait can be controlled by the neural system.
One effort for exploring chaotic locomotion has been made using a passive dynamic double pendulum model that walks down a slightly sloped surface, where one leg is in contact with the ground and the other leg swings freely with the trajectory of the system's center of mass15-17,69 (fig. 5A). Using the step time interval as an output of the model, the authors showed a cascade of period-doubling bifurcations as a function of the slope, starting with a period of one for the low slopes (i.e., same time interval for every step of locomotion) characterizing a periodic (limit-cycle) gait pattern and multiple periods for the high slopes (i.e., different time interval for the steps of locomotion) leading to a chaotic gait pattern (fig. 5B). A state space examination was also conducted from the simulated step time interval data series and the largest Lyapunov exponents were found to be first null and later positive, confirming the successive bifurcations from a periodic to a strange (chaotic) attractor with the slope. Hence, despite its simplicity, the model produced chaotic walking patterns with no active control, meaning that chaos may actually underlie the normal dynamics of the neuromuscular system.
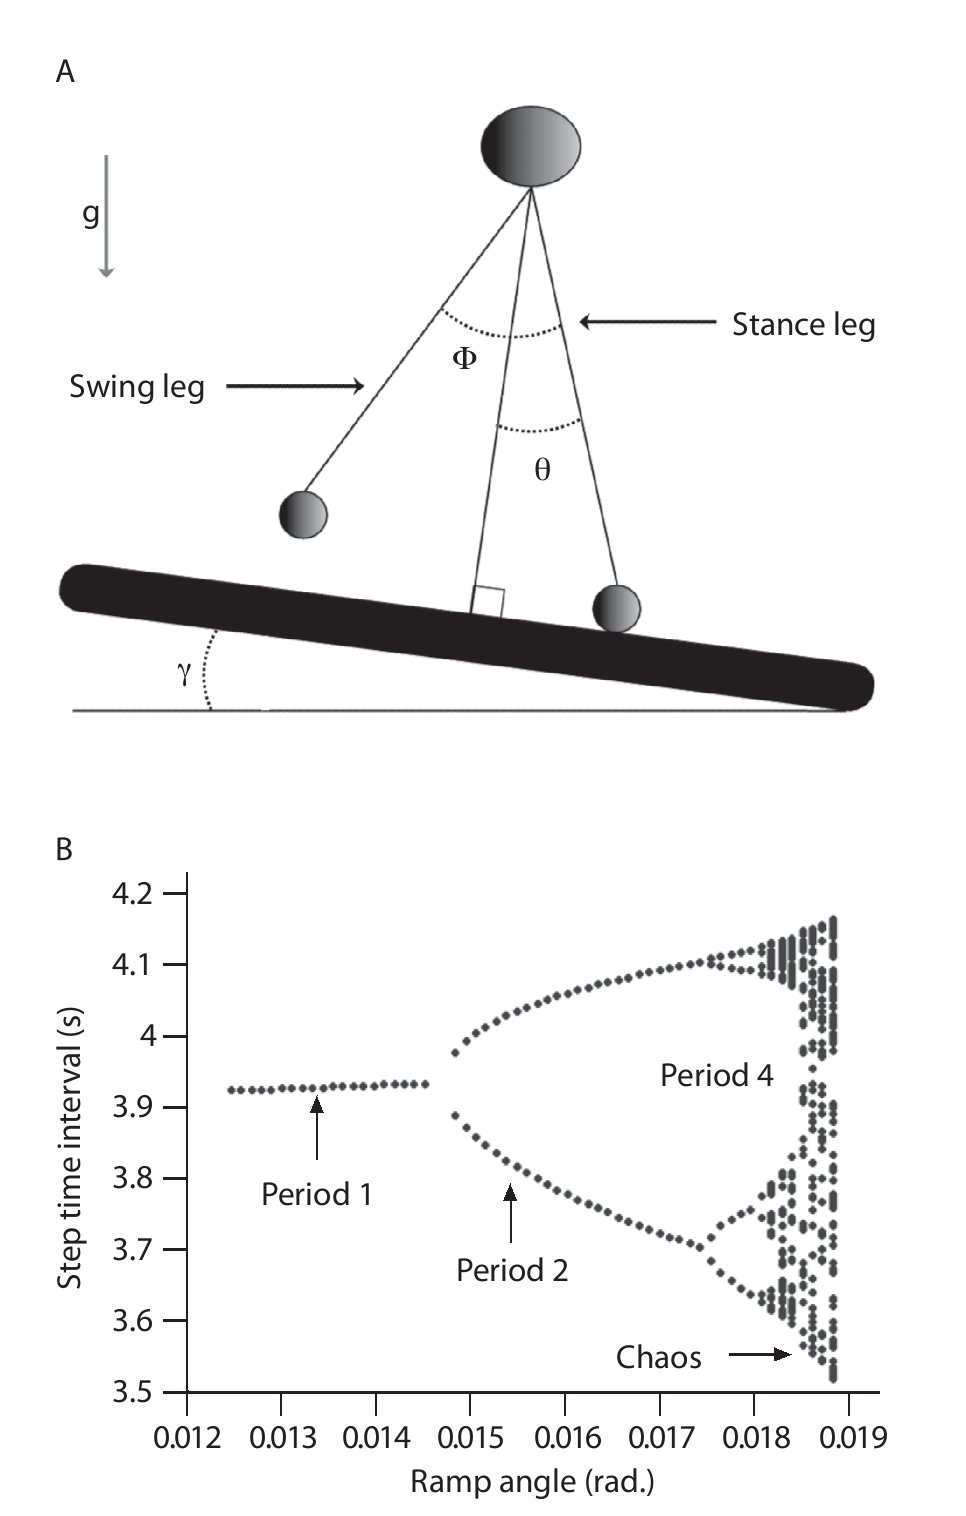
Fig. 5. A. Passive dynamic walking model that has a chaotic gait pattern. B. Bifurcation diagram of the gait patterns generated by the model as a function of the slope. The period is similar to the number of different step time intervals chosen by the walking model during a steady state gait. For example, period-1 means that the model adopt one step time interval during the gait and then a periodic pattern, period-2 that the model alternates between two different step time intervals revealing a quasi-periodic pattern, and so on until chaotic patterns.
Also, a major aim of the authors was to connect such complex locomotive dynamics with active neural control mechanisms to understand how the nervous system can take advantage and utilize the properties of the attractors generated by the model, and especially of the strange attractor. Using an artificial neural network (ANN) that modulates hip joint actuation (i.e., by setting the joint stiffness) during the leg swing, Kurz and Stergiou15,17 showed the possibility to induce transitions between the period-n gait patterns (i.e., any step time intervals) of the model. In particular, while the model would be unstable and fall down for highly slope values, the ANN was capable of selecting a hip joint actuation that transitioned the locomotive system to a stable gait that was embedded in the chaotic attractor and prevented falls. Also, faced an unforeseen perturbation, the ANN was capable of selecting a hip joint actuation that rapidly transitioned the locomotive system to a stable gait, preventing falls again. Hence, such results strongly support that chaos provide flexibility in the neuromuscular system by providing a mechanism for transitioning to stable gait patterns that are embedded in the chaotic system (as required in the ever-changing walking environment) and that changes in the chaotic structure of gait pattern observed in the literature may be related to the neural control of the gait pattern.
Another significant modelling effort of the human locomotion that governs the stride time interval series has been made using a family of stochastic network of neurons, or central pattern generators (CPG), capable of producing syncopated output2,68. Specifically, these models take the form of a random walk moving on a finite-size correlated chain of virtual firing nodes, each node generating an impulse of particular intensity that induce an output signal of particular frequency. Using such a network structure, the authors were capable of producing stride time interval time series with long term correlations as those observed normally in human walking (i.e., 0.5 < α ≤ 1 ). West and Scafetta70 and Scafetta et al71 have then proposed an extension of these models, called the super-CPG, in which the authors coupled a stochastic CPG to a Van der Pol oscillator. In others words, while the first models only aimed to reproduce the chaotic properties of gait using a schematic neural structure, this model is based on the assumption that human locomotion is regulated both by the nervous system (through the stochastic CPG) and the motor control system (through the oscillator). The model assumes that each cycle of the oscillator, which represents the lower limb, is initiated with a new virtual inner frequency produced by the stochastic CPG. However, the real stride-interval coincides with the actual period of each cycle of the Van der Pol oscillator, its period depending of the inner frequency coming from the stochastic CPG but also on the amplitude and the frequency of an external forcing function. Accordingly, the gait frequency and then the time stride interval are slightly different from the inner frequency induced by the neural firing activity. The authors then modulated the strength of the forcing function in order to force the frequency of the cycle as in under metronome-triggered gait conditions (i.e., conscious stresses).
It was observed that the properties of the generated time series were similar to those observed from the experiments with an increase in randomness. As a consequence, these results seem to prove that the control of the chaotic gait structure would come from low and high nervous centres, including spinal neural networks (i.e., CPGs) and more "voluntary" nervous structures (i.e., the central nervous system).
Conclusions
In this review, most commonly used nonlinear tools for the exploration of gait complexity were described as well as their potential importance to provide insight into mechanisms underlying "pathological" conditions of human gait. Far from being a source of error, evidence supports the necessity of an optimal state of variability for health and functional movement. Healthy systems exhibit "organized" variability. In gait, disease (e.g., idiopathic fallers) or unhealthy (e.g., physical inactivity) states may manifest with increased or decreased complexity of lower extremities walking behaviour as it was found in elderly fallers compared with healthy controls and in inactive older adults compared to those that are more active. Unhealthy state is also associated with a loss of self-similarity and long-range dependence. For instance, DFA, a measure of long-range persistence (dependence), was found to be decreased in fallers, and even more in patients with Huntington's disease, with the apparition of an uncorrelated (or anti-persistent) dynamics. These findings are completely in line with earlier findings in human physiology, suggesting that the pathological state should be better conceptualized as a part of "dynamic reordering" rather than as manifestations of a disordering process73. The concepts of variability and complexity, and the nonlinear tools used to measure these concepts open new vistas for research in gait dysfunction of all types. Besides, the recent modelling effort of the human locomotion provided the groundwork to better understand how motor control strategies and the mechanical constructs of the locomotion system influence the chaotic properties (complexity) of the gait.
Acknowledgments
This work is supported by the NIH (K25HD047194), the NIDRR (H133G040118 and H133G080023), the Nebraska Research Initiative, and the Department of Geriatrics of the University of Nebraska Medical Center.
Correspondence:
N. Stergiou.
Nebraska Biomechanics Core Facility. University of Nebraska at Omaha. 6001 Dodge Street. Omaha, NE 68182-0216, USA.
E-mail:
nstergiou@unomaha.edu
History of the article:
Received August 31, 2009.
Accepted October 5, 2009.